
Data table design examples
A data table displays records in rows and their attributes in columns, so people can scan, compare and act on them. These examples come from dashboards, admin panels and SaaS products.
Muzli collects new design work from 200+ sources every day. This collection picks the best of it and changes as new work comes in.
Last update:
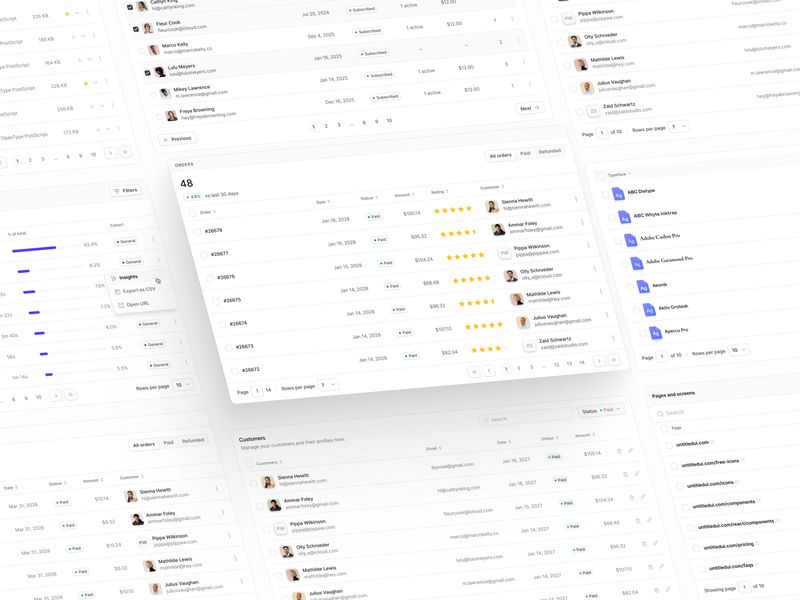
Data tables

Table | Sana AI - Your AI assistant for work
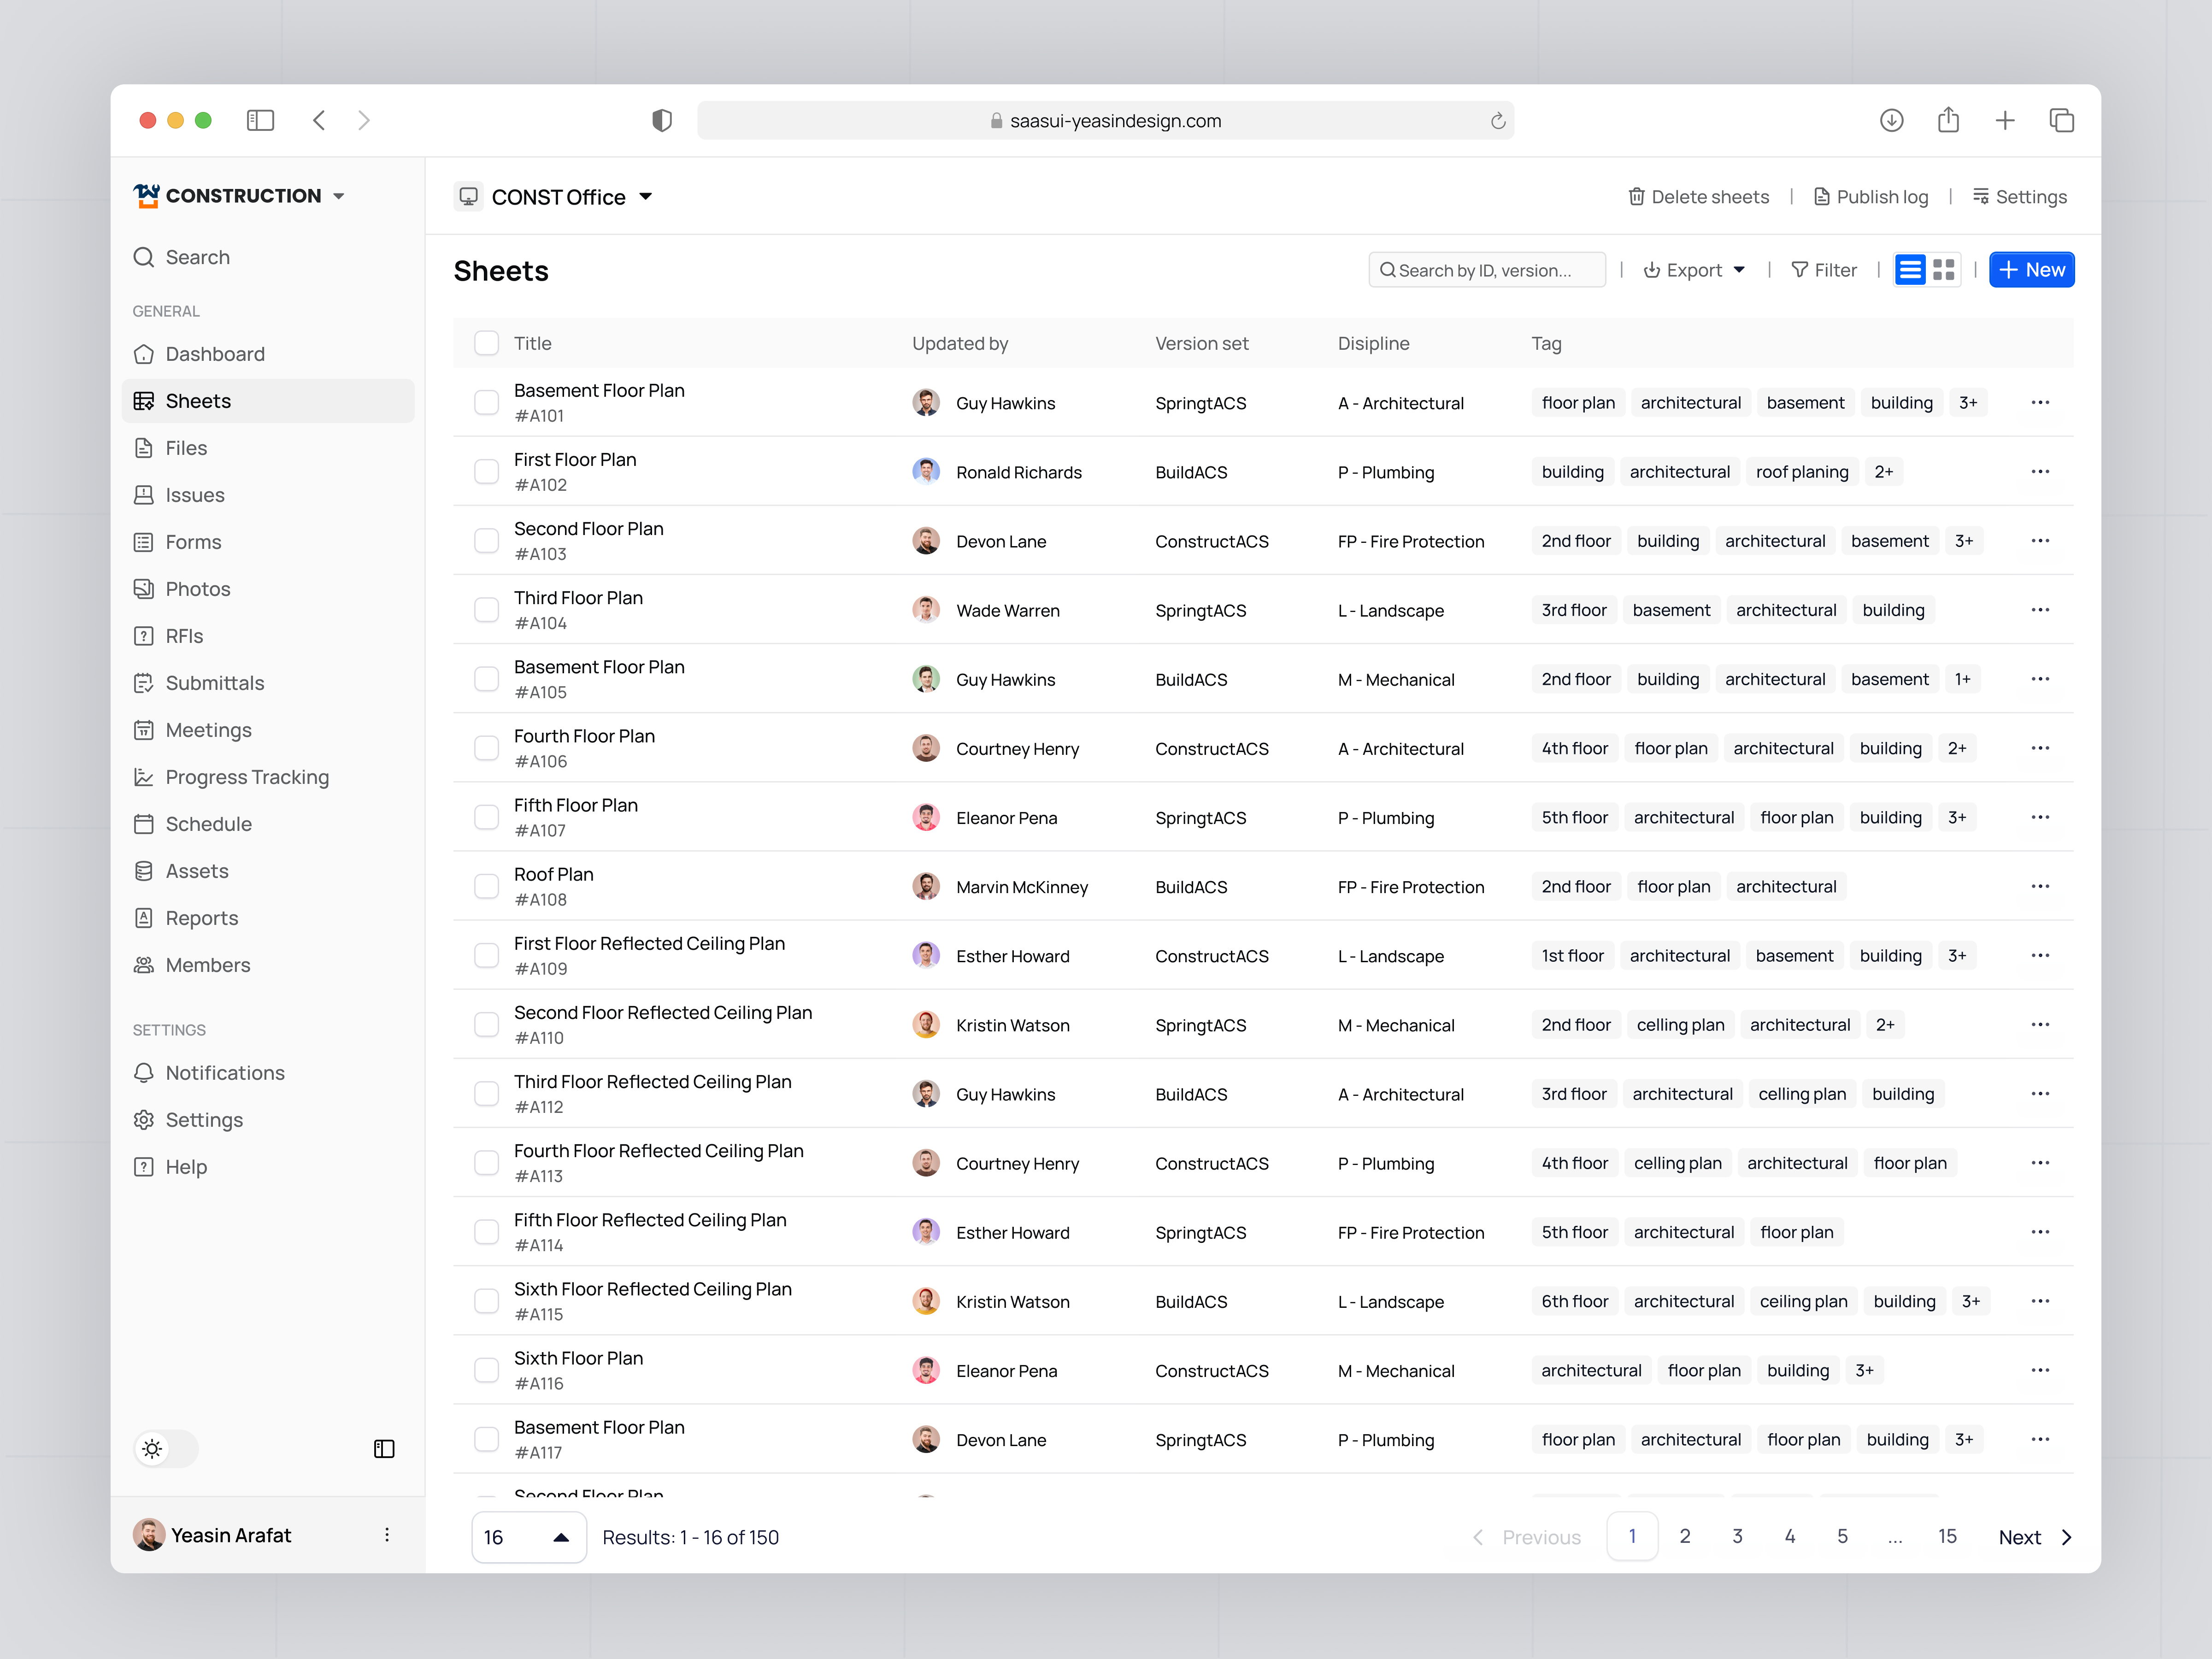
Sheets Table UI – Construction Management SaaS Web App

Table | Airwallex - Trusted global payments & financial platform
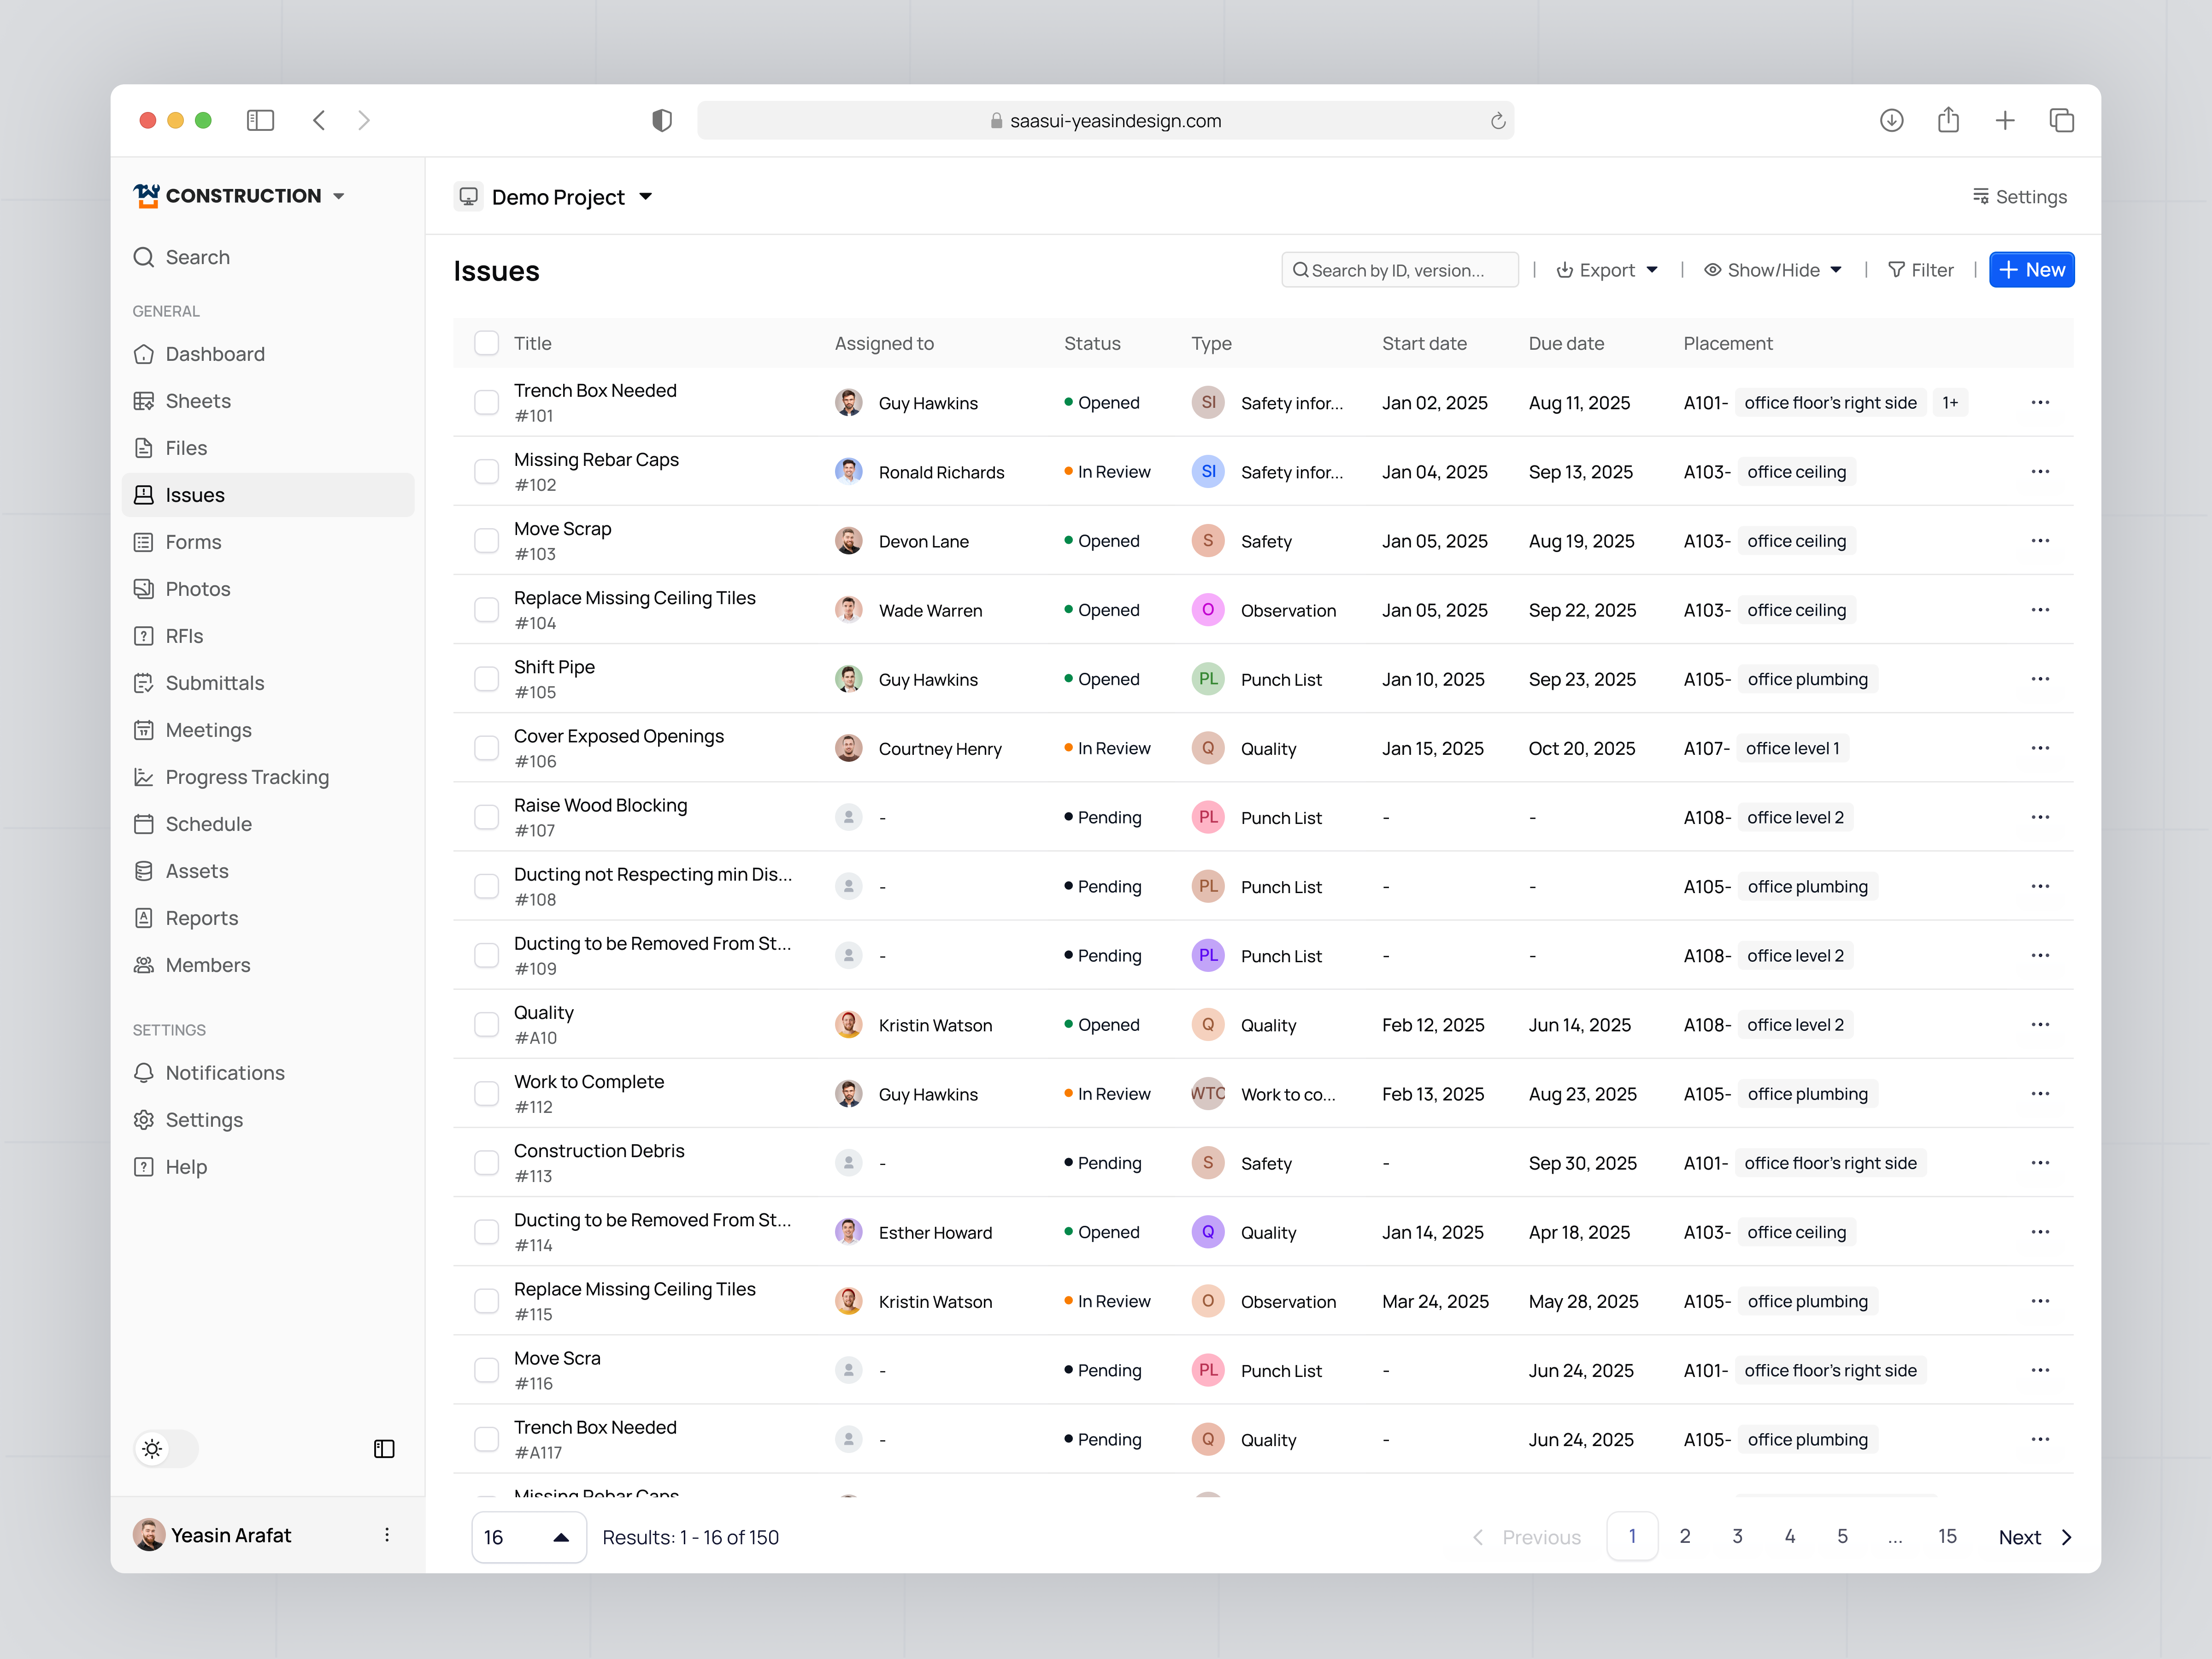
Issues Table UI – Construction Management SaaS Web App

Table | v0 - Build anything with AI

Saas Product Design for U.S. Immigration Lawyers

Table | Modal - High-performance AI infrastructure
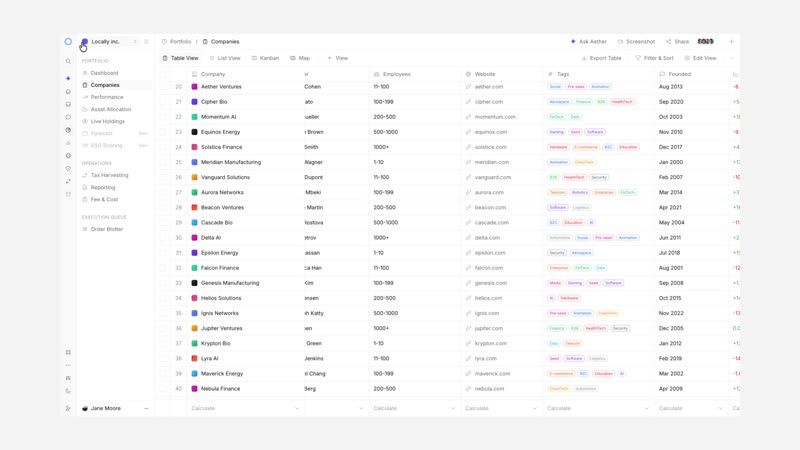
Collapsible left-sidebars and width-resizable data table columns (Dark & light mode).

Software design - Risk Assessment

Table | Replit - Build apps and sites with AI
This is 1% of what Muzli shows you.
Get the rest — fresh design inspiration on every new tab, free.
Add Muzli — free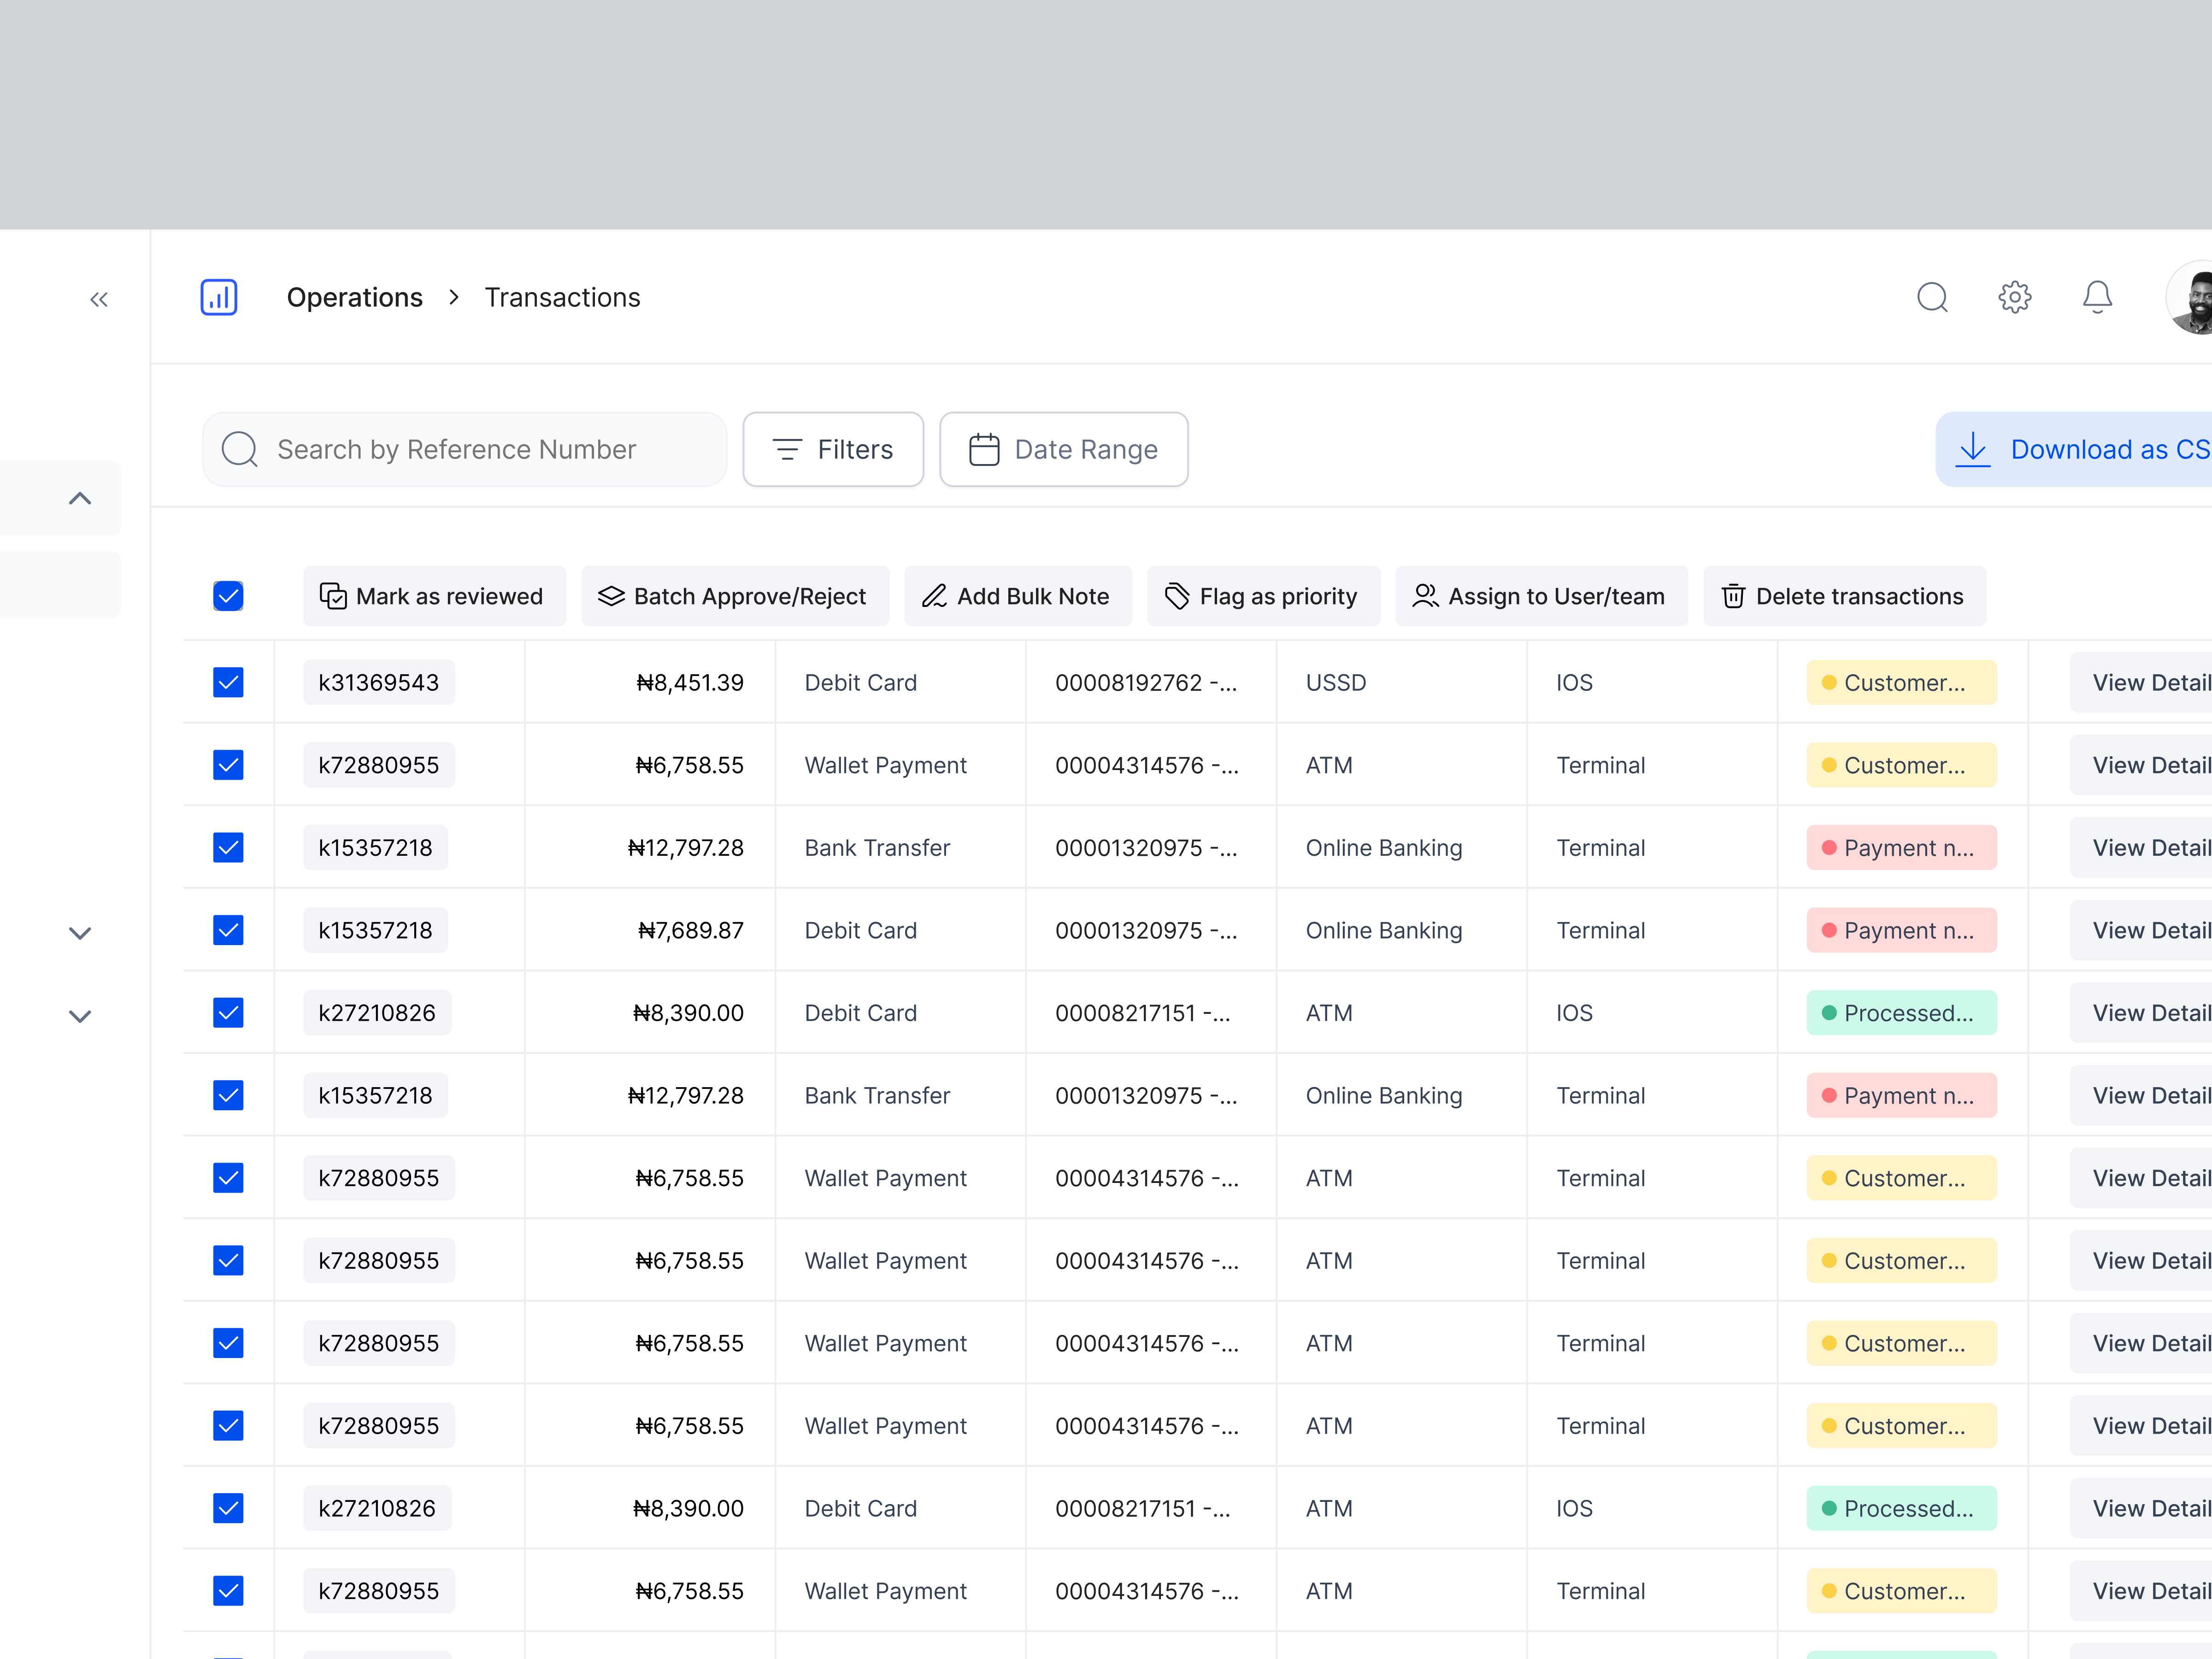
Table Design with Bulk Actions

Table | Deputy - Employee scheduling, HR & payroll software

ERP Dashboard Redesign- Modern Accounting Dashboard UI
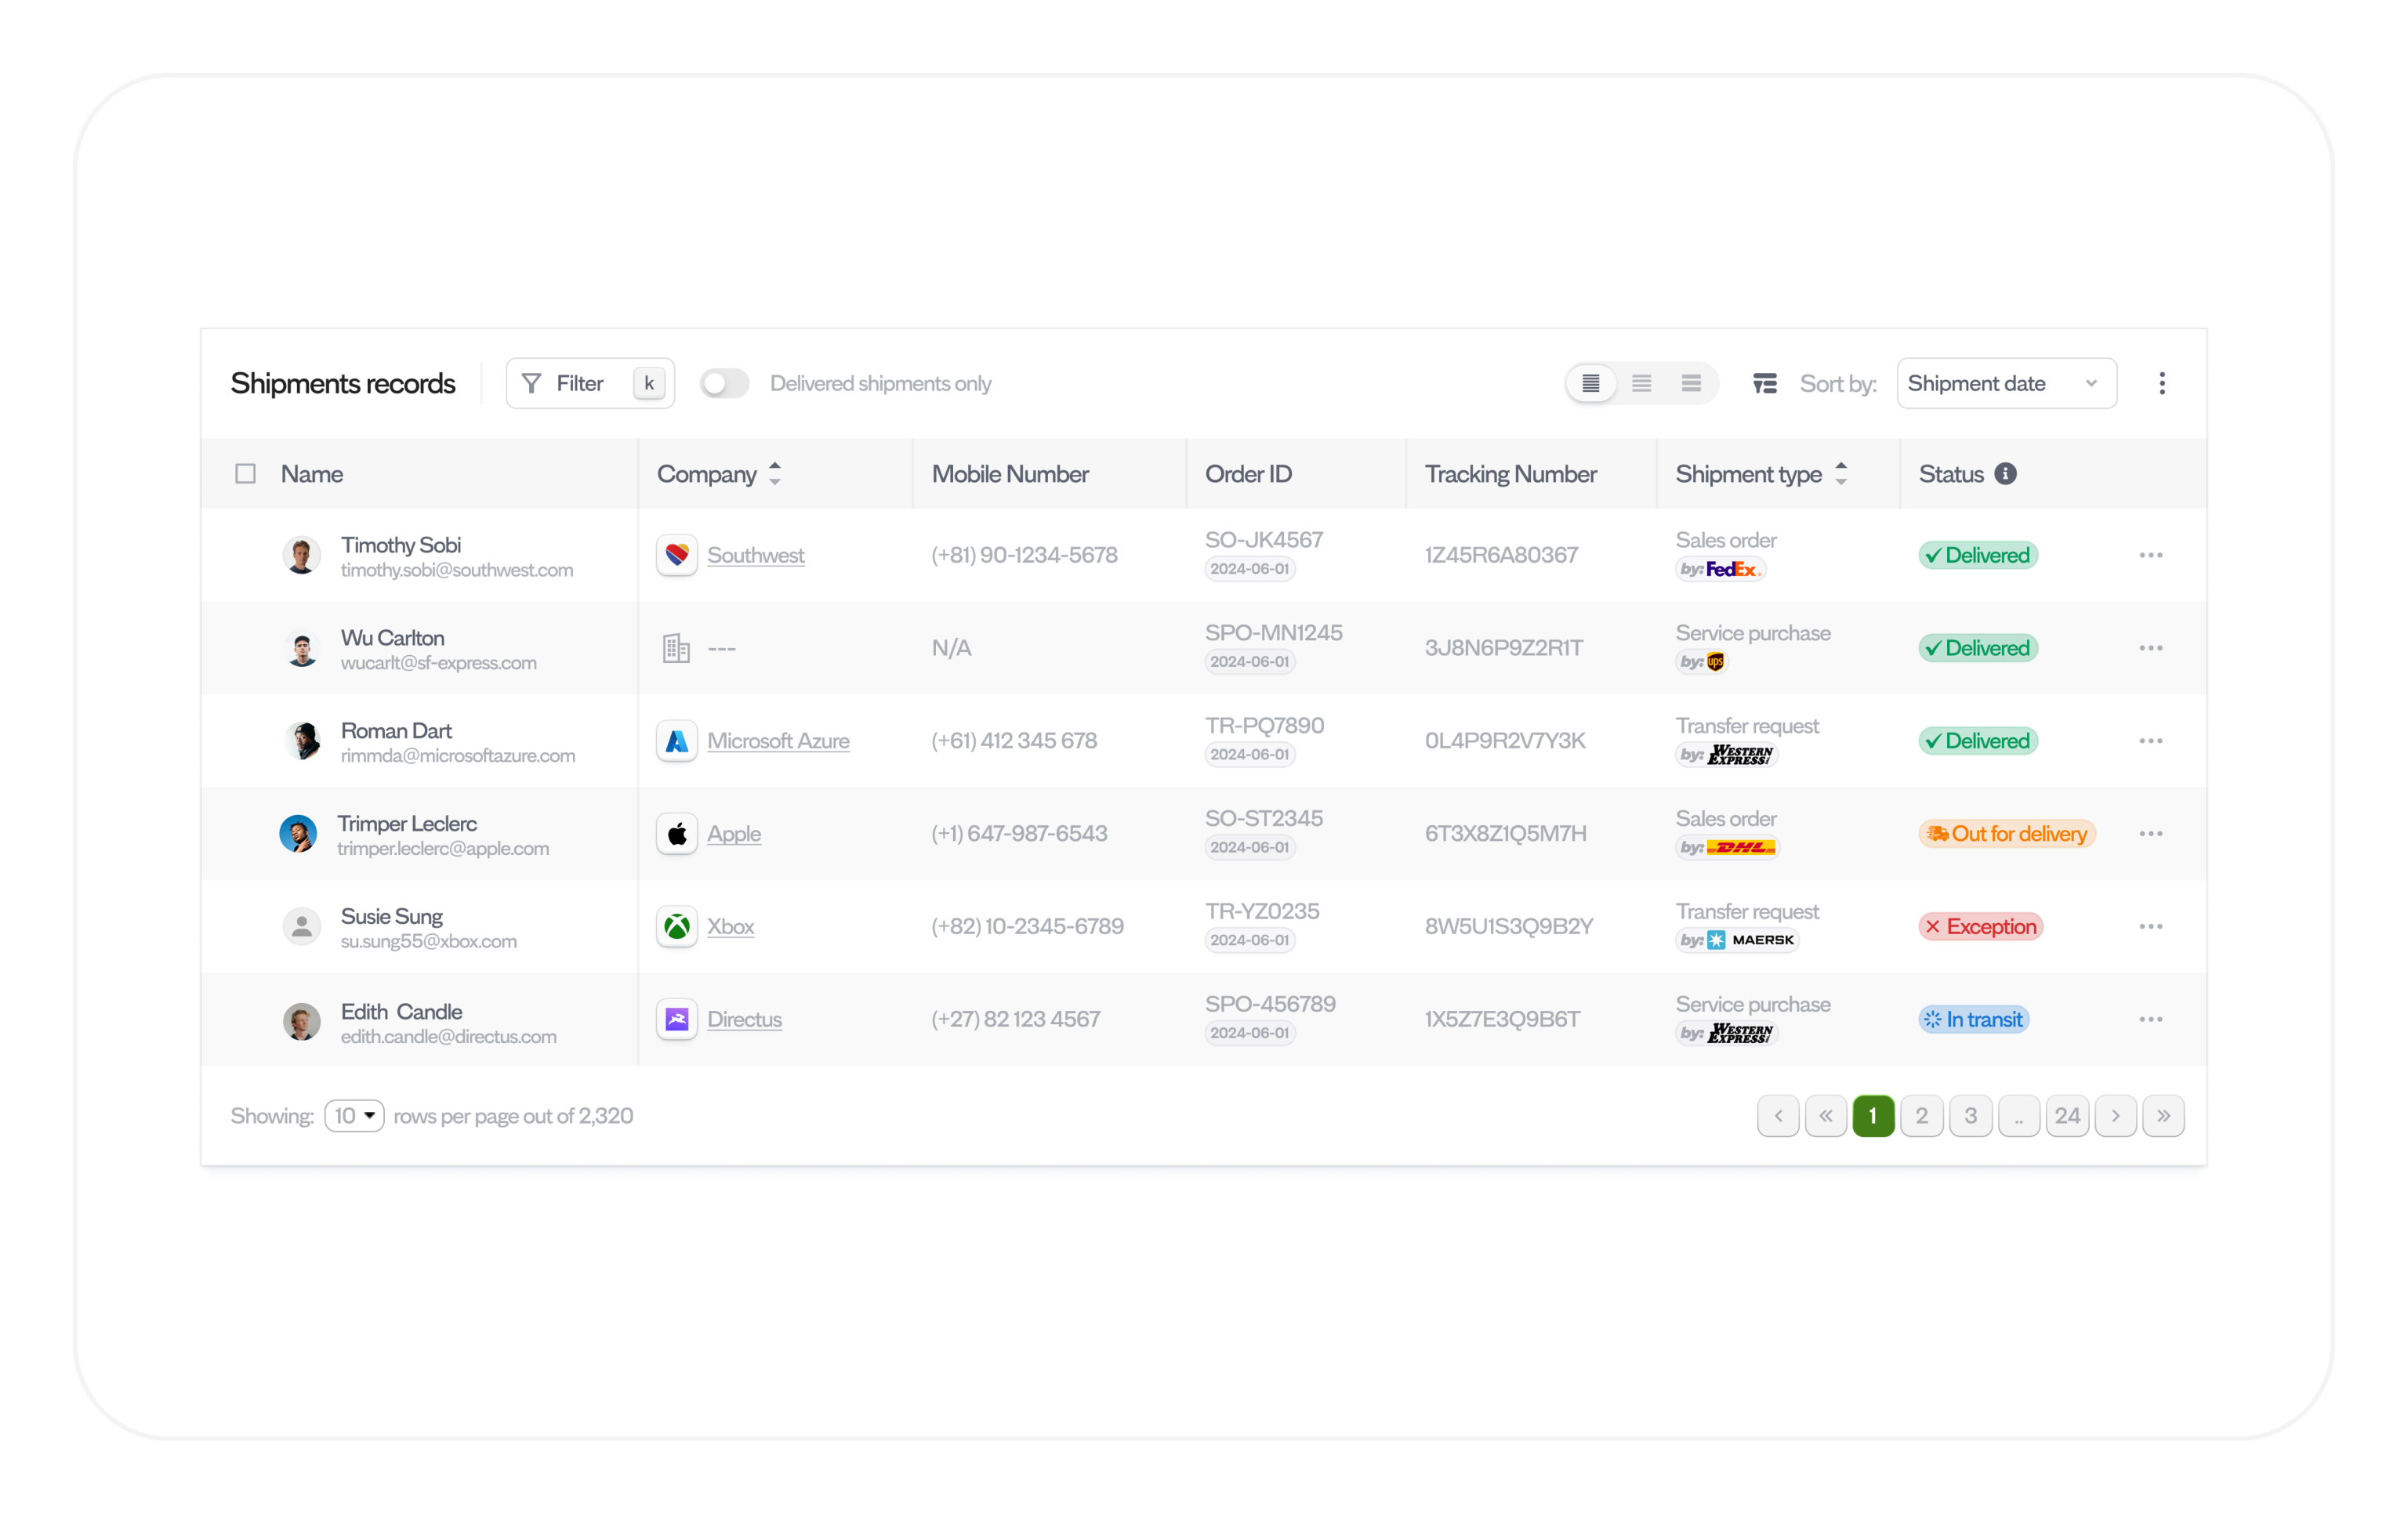
Data table design

Table | Arcade - Bring your product story to life in minutes

File and asset management - UX/UI
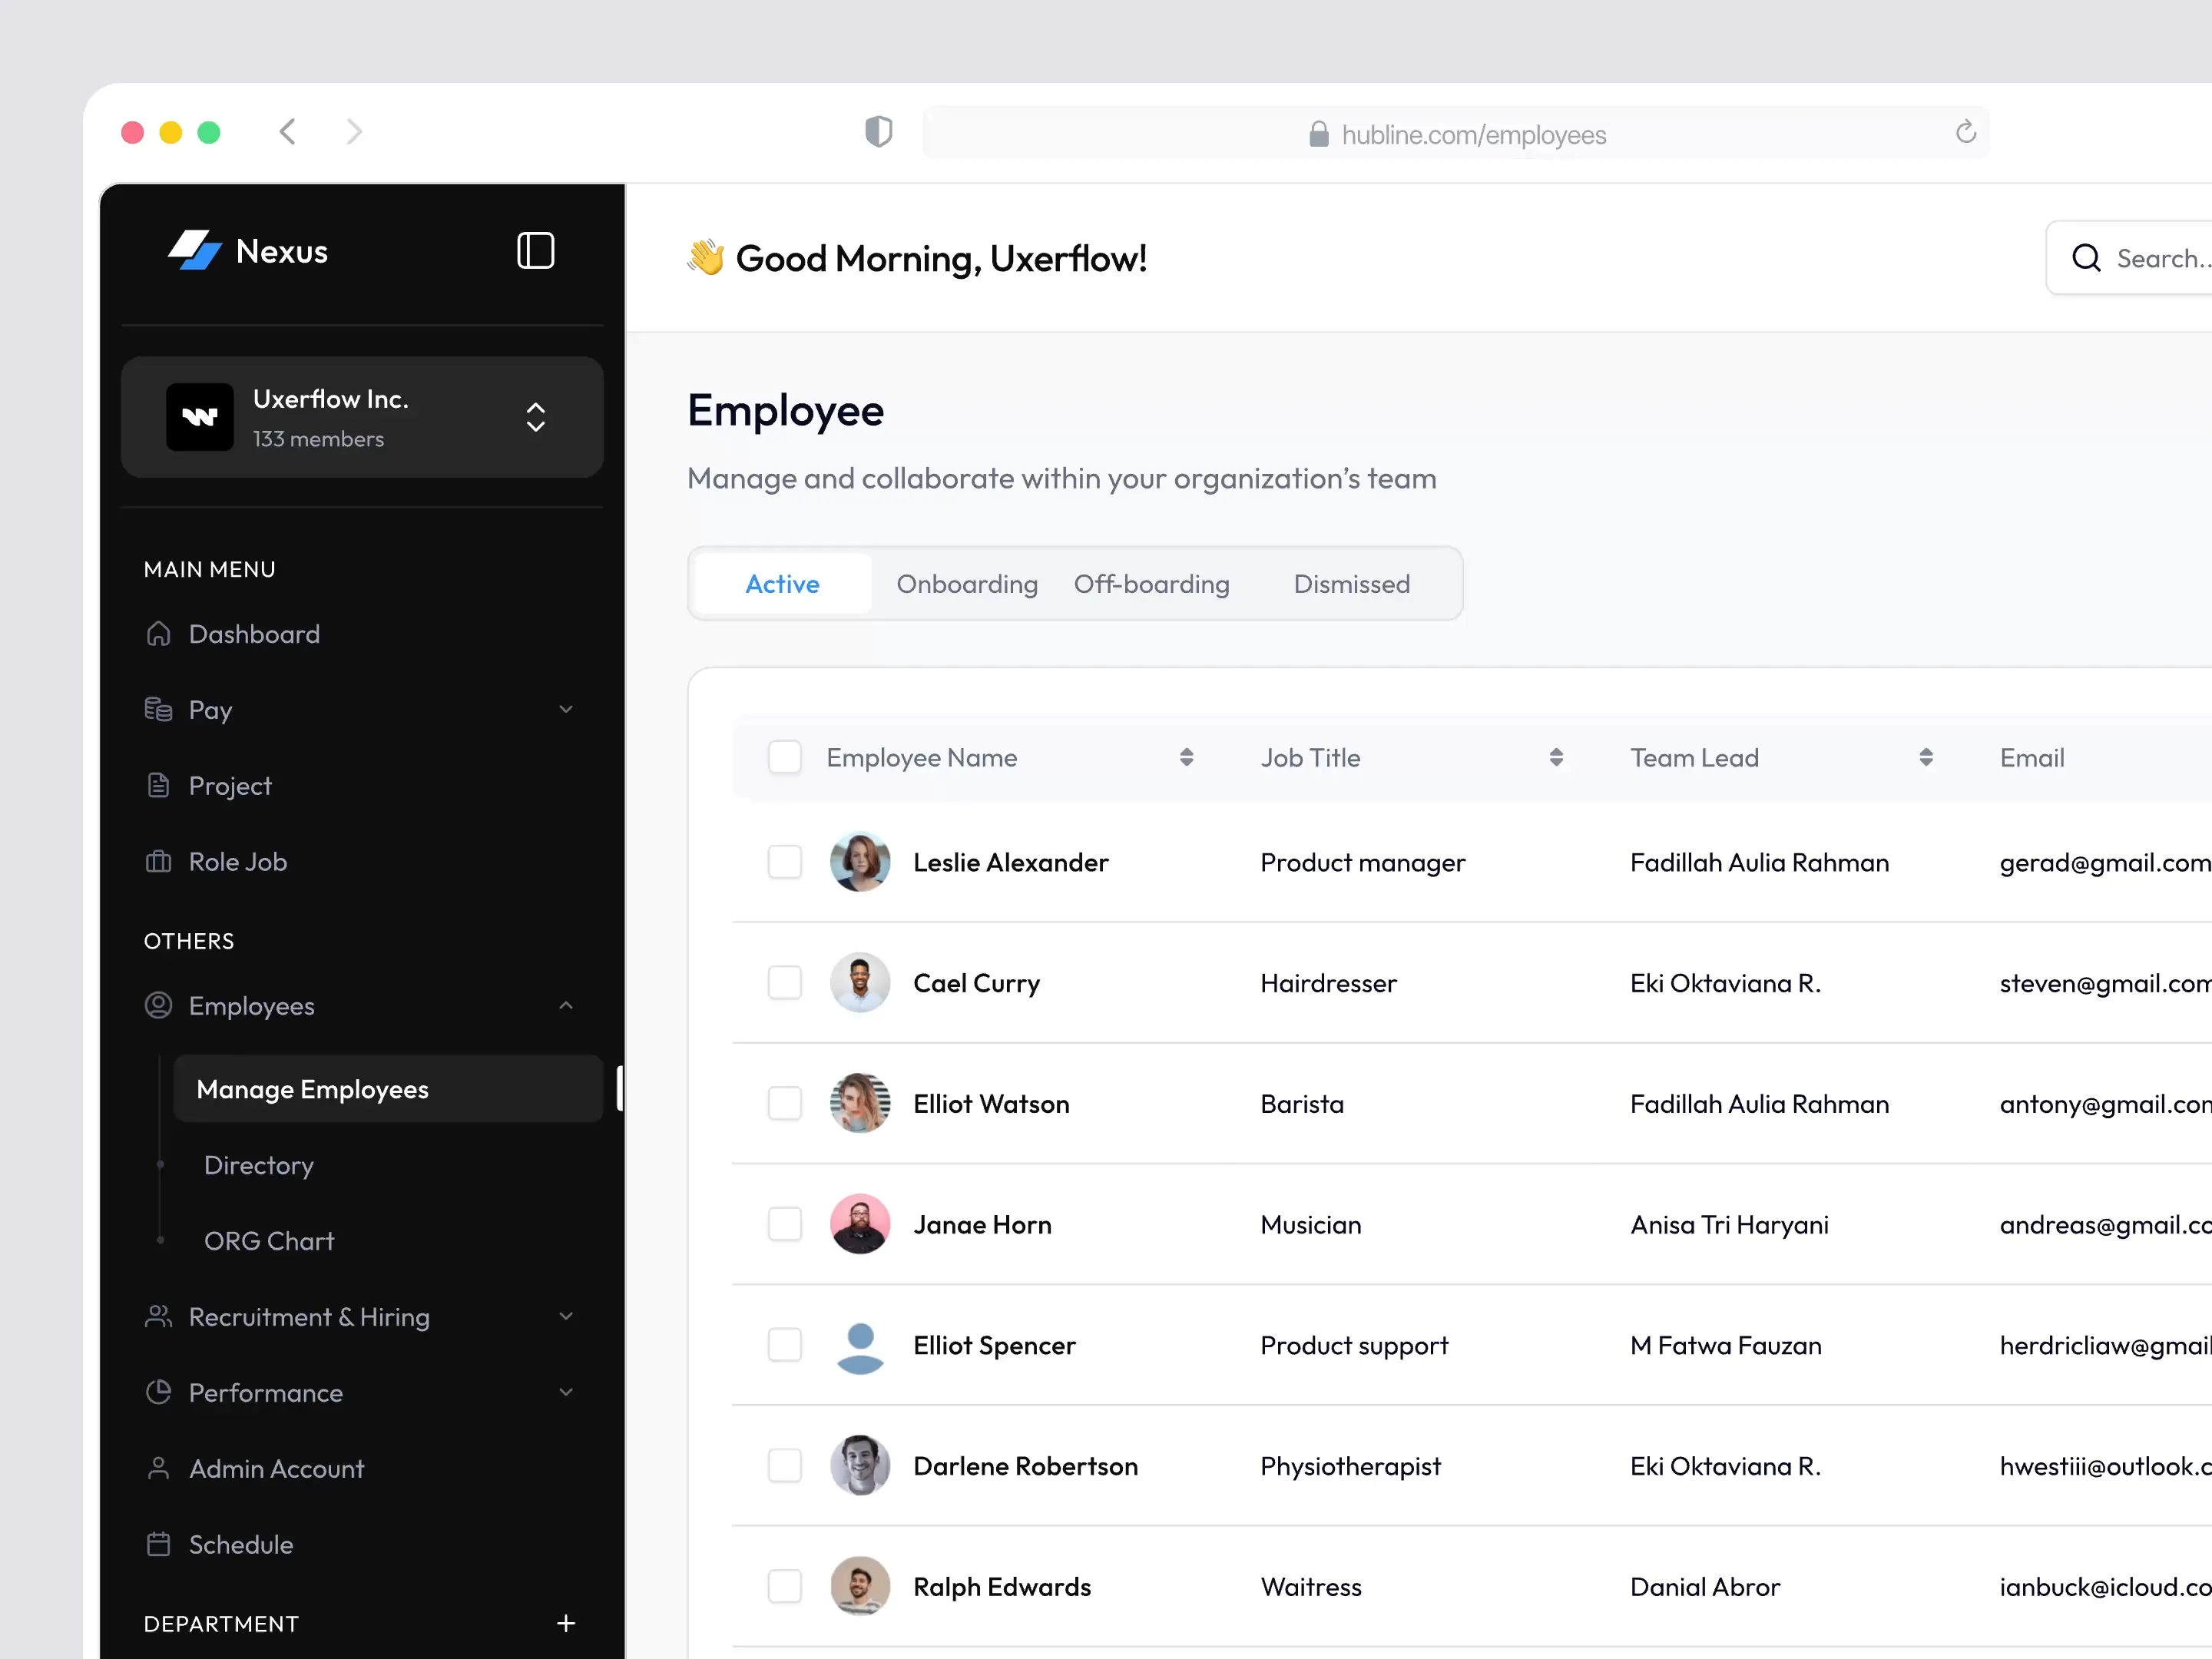
Hubline: Table Design

Table | Lifesum - AI calorie counter

RecruitSmart — Job Application Management for School HR Systems
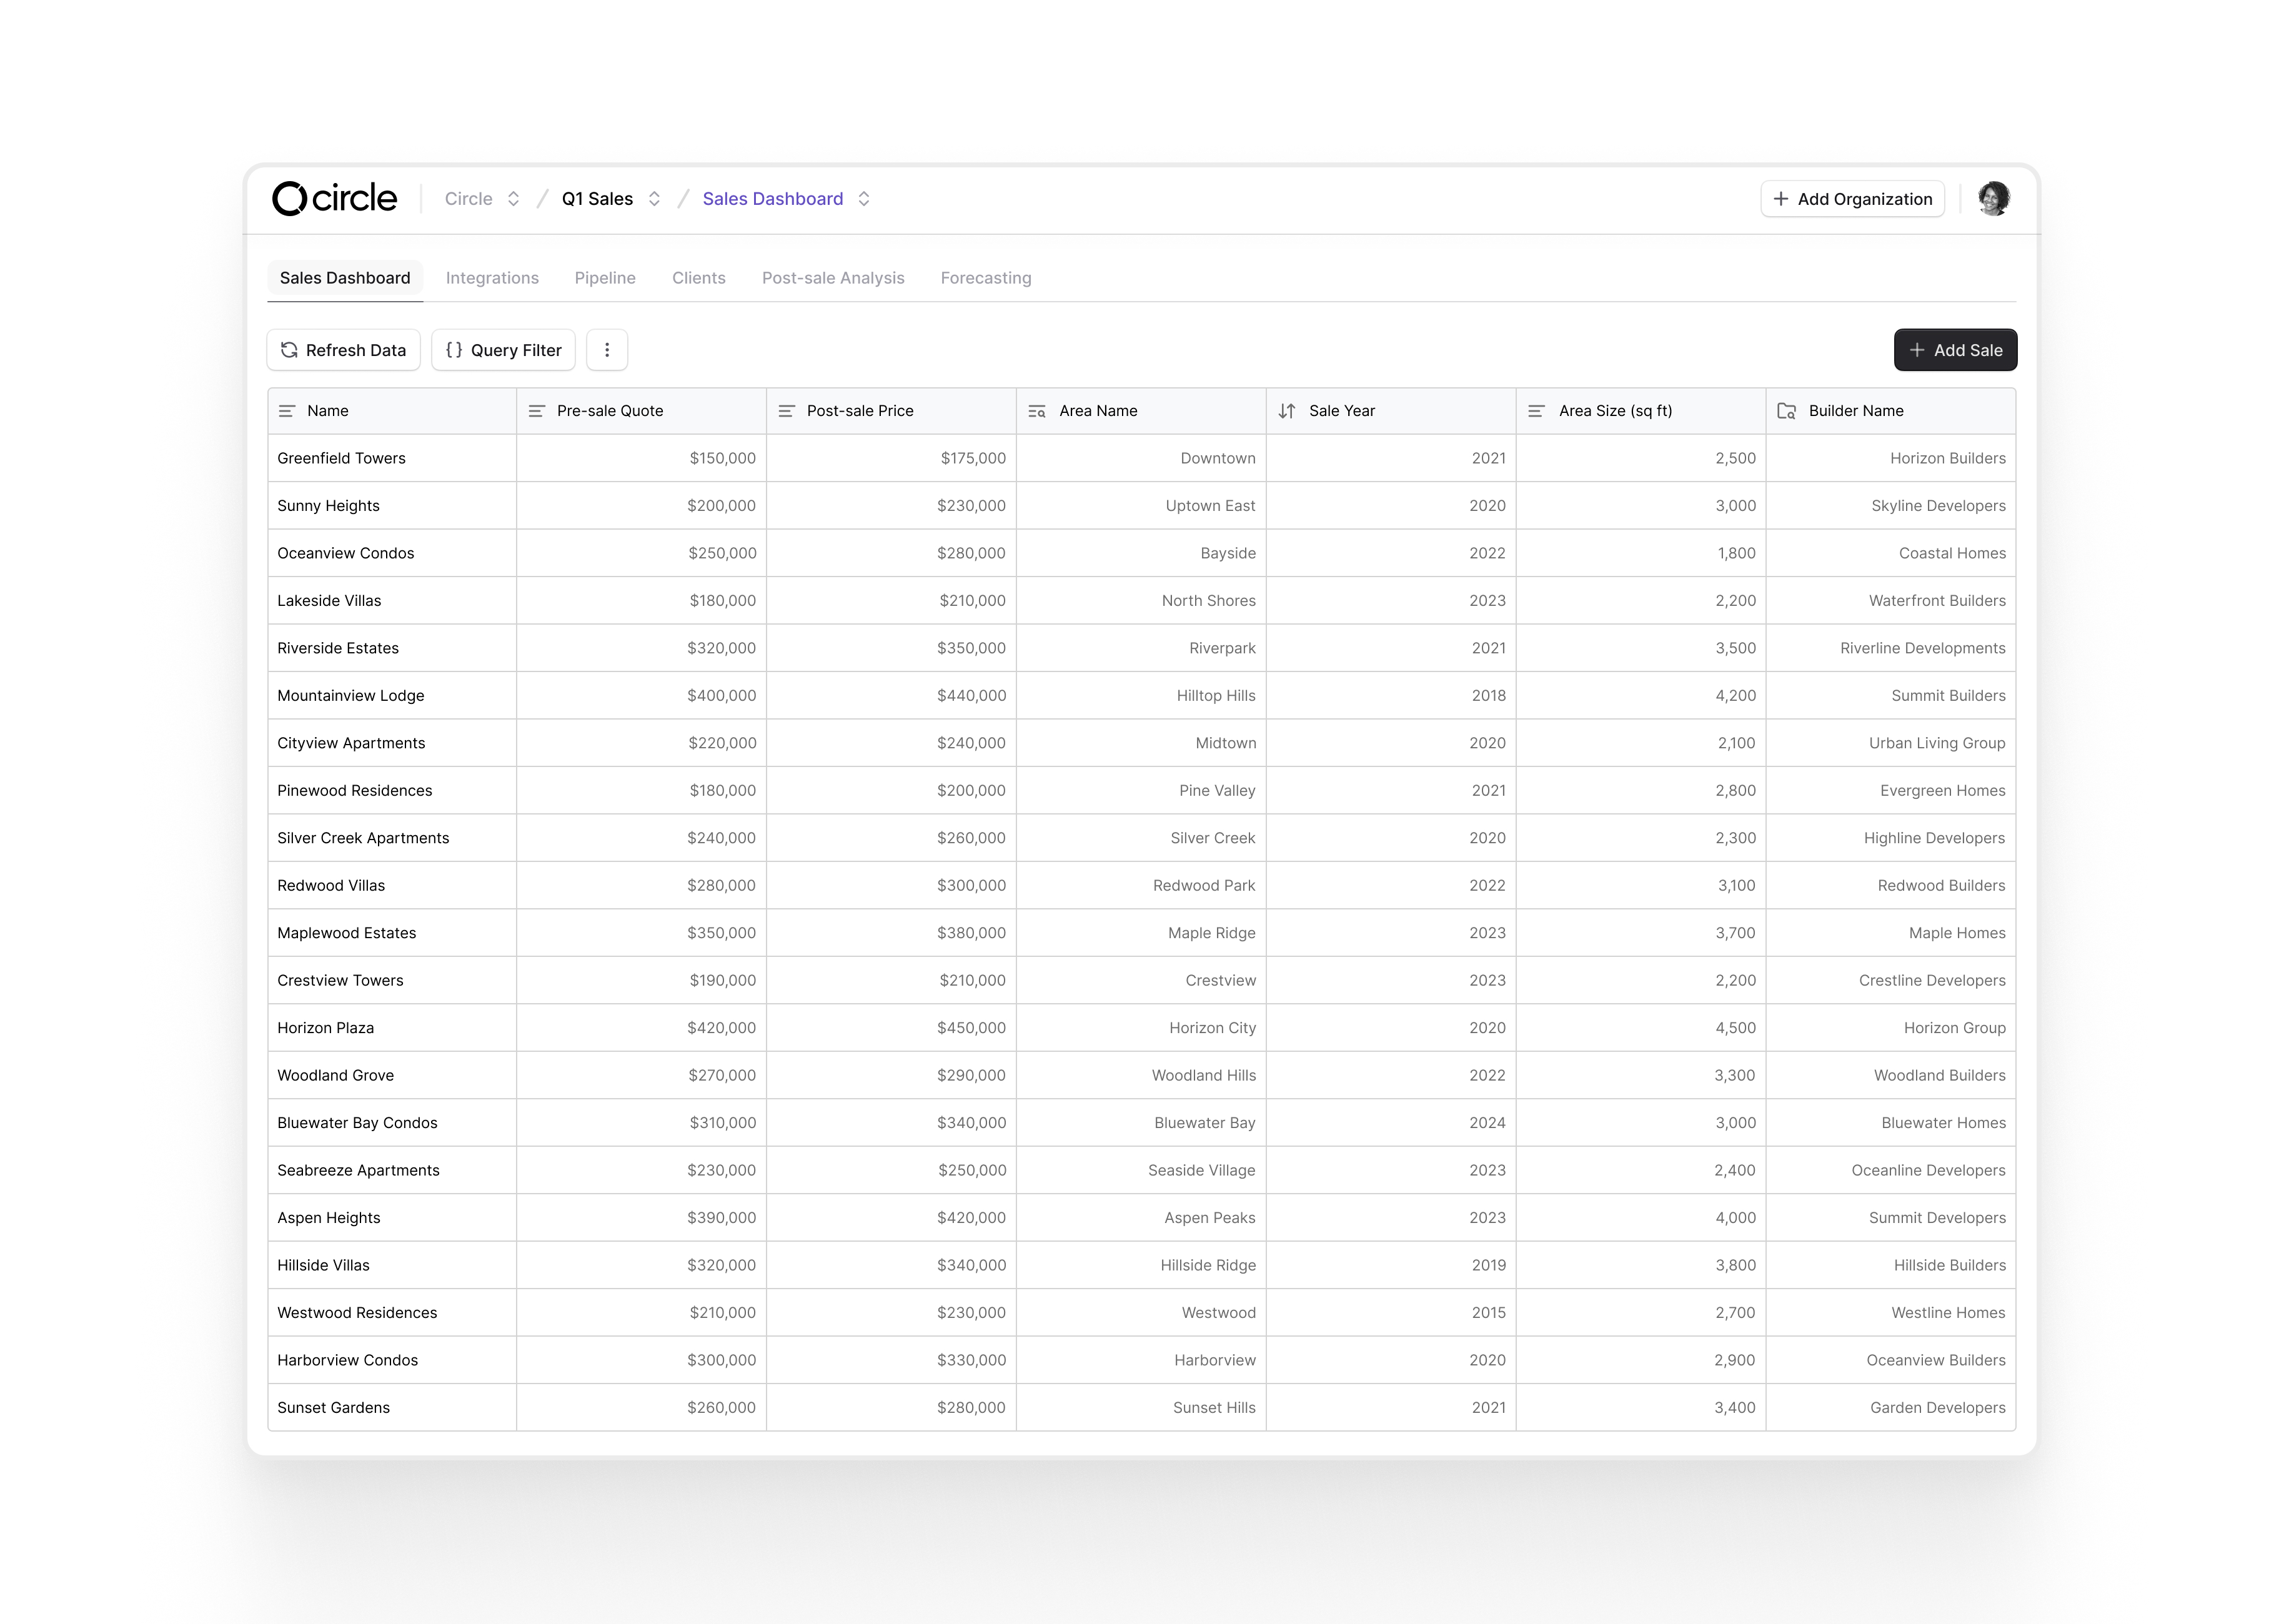
Data table ui

Table | HoneyBook - AI-powered client relationship platform

Finvest - P2P Trading Dashboard Design
This is 1% of what Muzli shows you.
Get the rest — fresh design inspiration on every new tab, free.
Add Muzli — free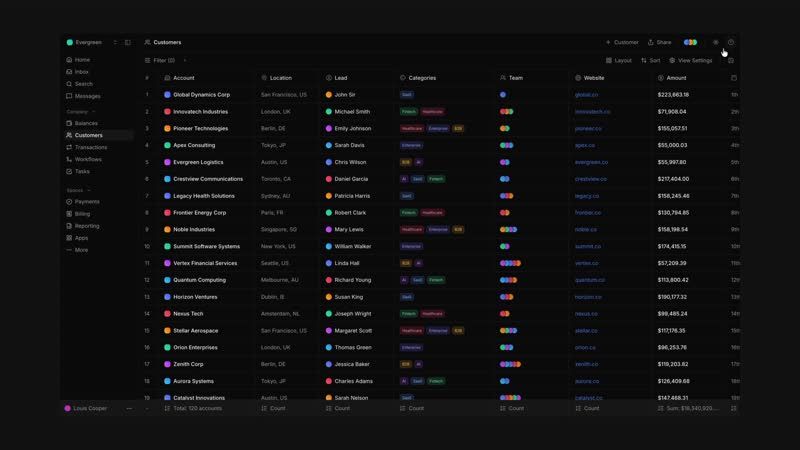
Customer account drawer/slider for a CRM table UI (Width-resizable).

Table | Magnific - The AI creative platform
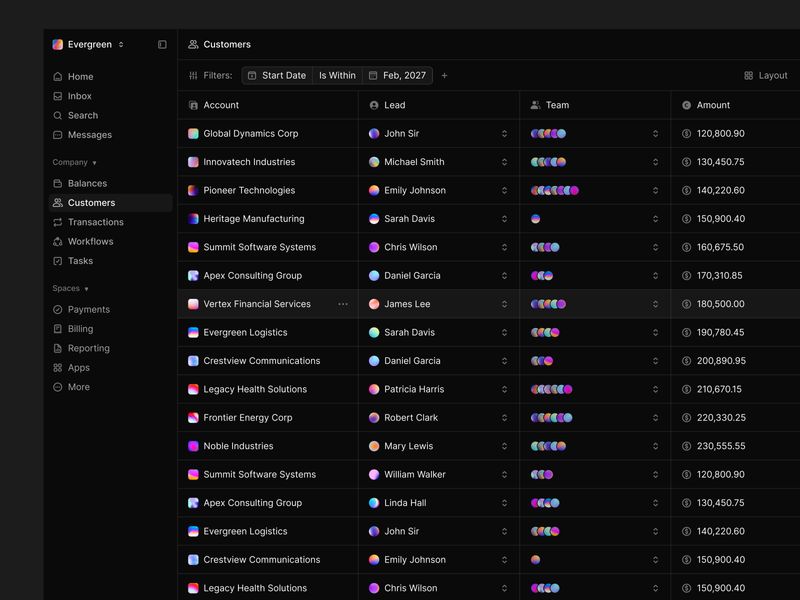
Customer Data Table

Tiimi – Candidate Recruitment List in SaaS HR Platform

Table | Navattic - Accelerate the buyer journey with demos
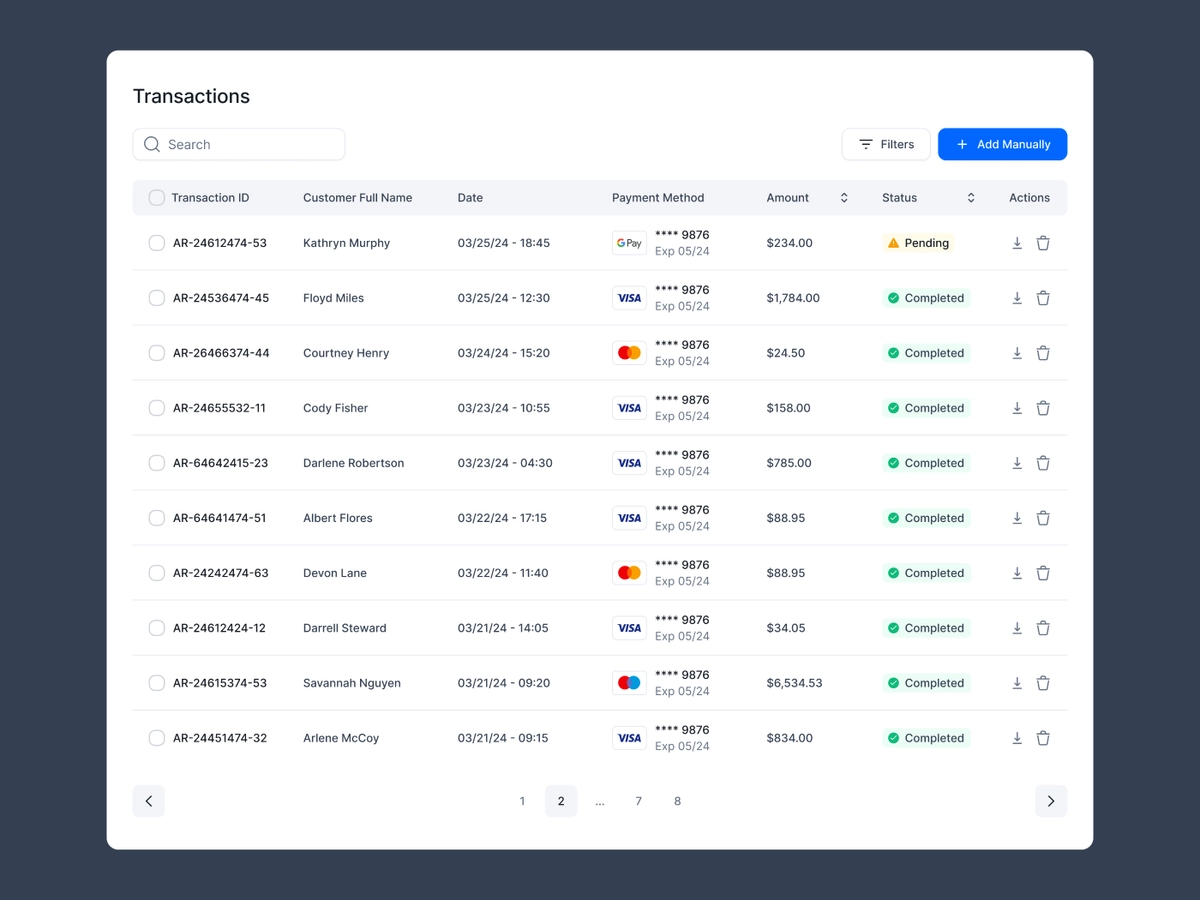
SaaS Table UI

Table design customer dashboard design

Table | Cofounder - Run an entire company with AI agents

Simply AI recruitment | Dashboard design mockup | SaaS

Search Function [Data Table]

Table | Apple Music - Over 100 million songs

Caplon Market Prices
This is 1% of what Muzli shows you.
Get the rest — fresh design inspiration on every new tab, free.
Add Muzli — free
Data table view | Light version

Table | Devin - The AI software engineer

CRM Dashboard Design
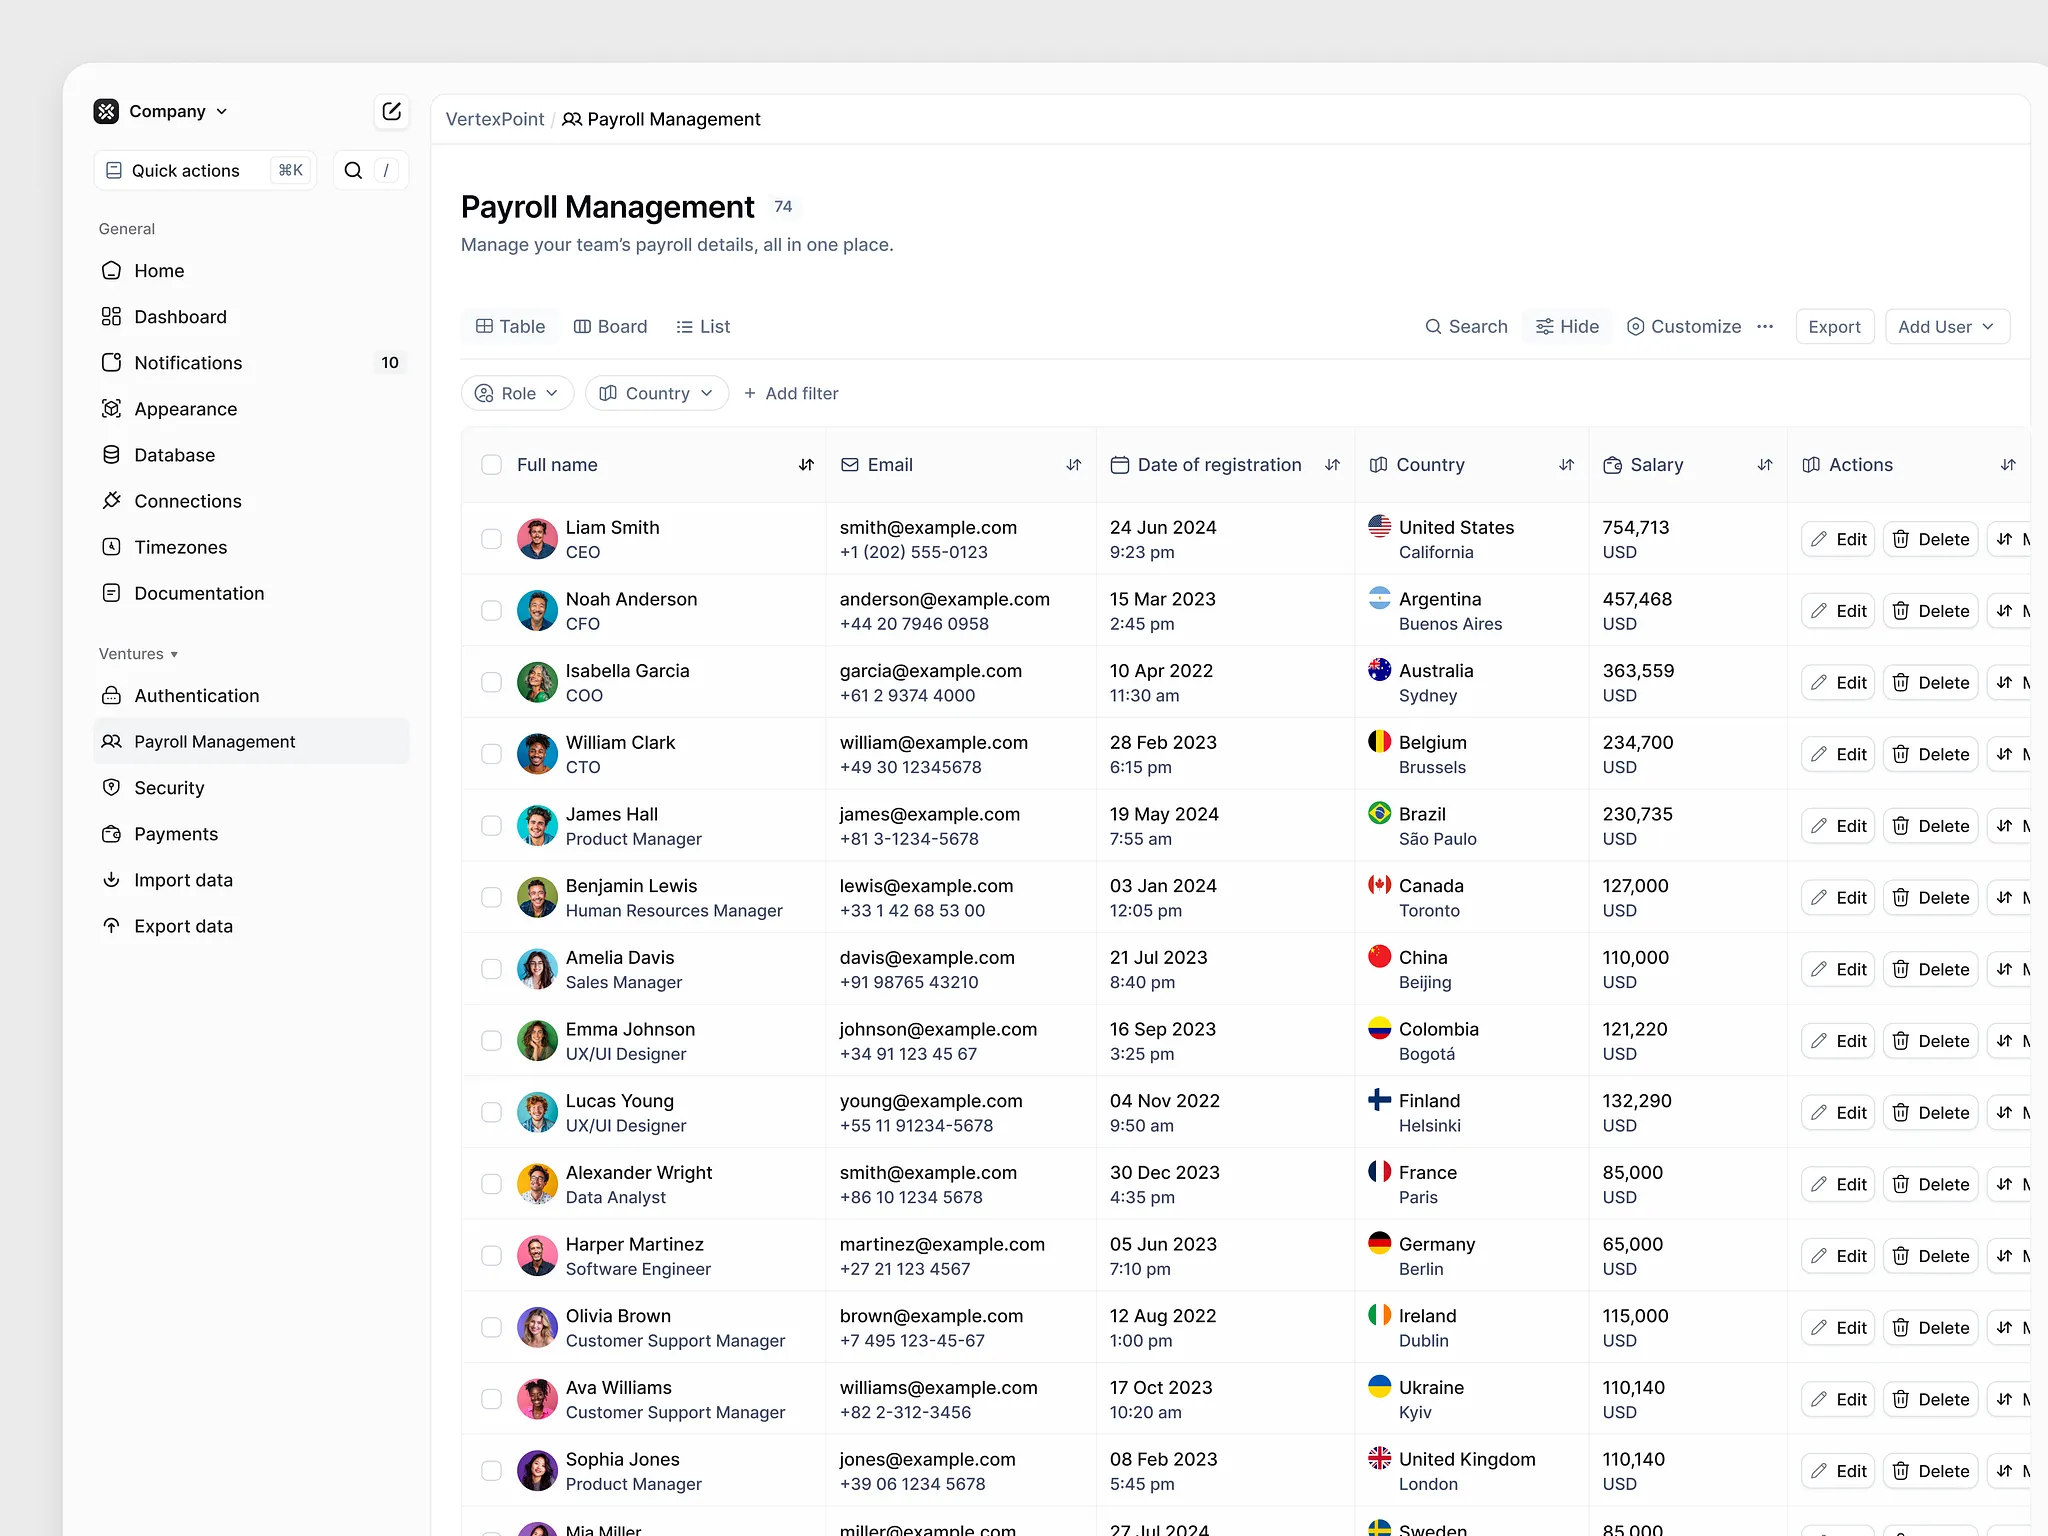
Double Rows in Data Tables

Table | Wrangle - The AI sourcing and outbound platform

Brokerage activity — Untitled UI
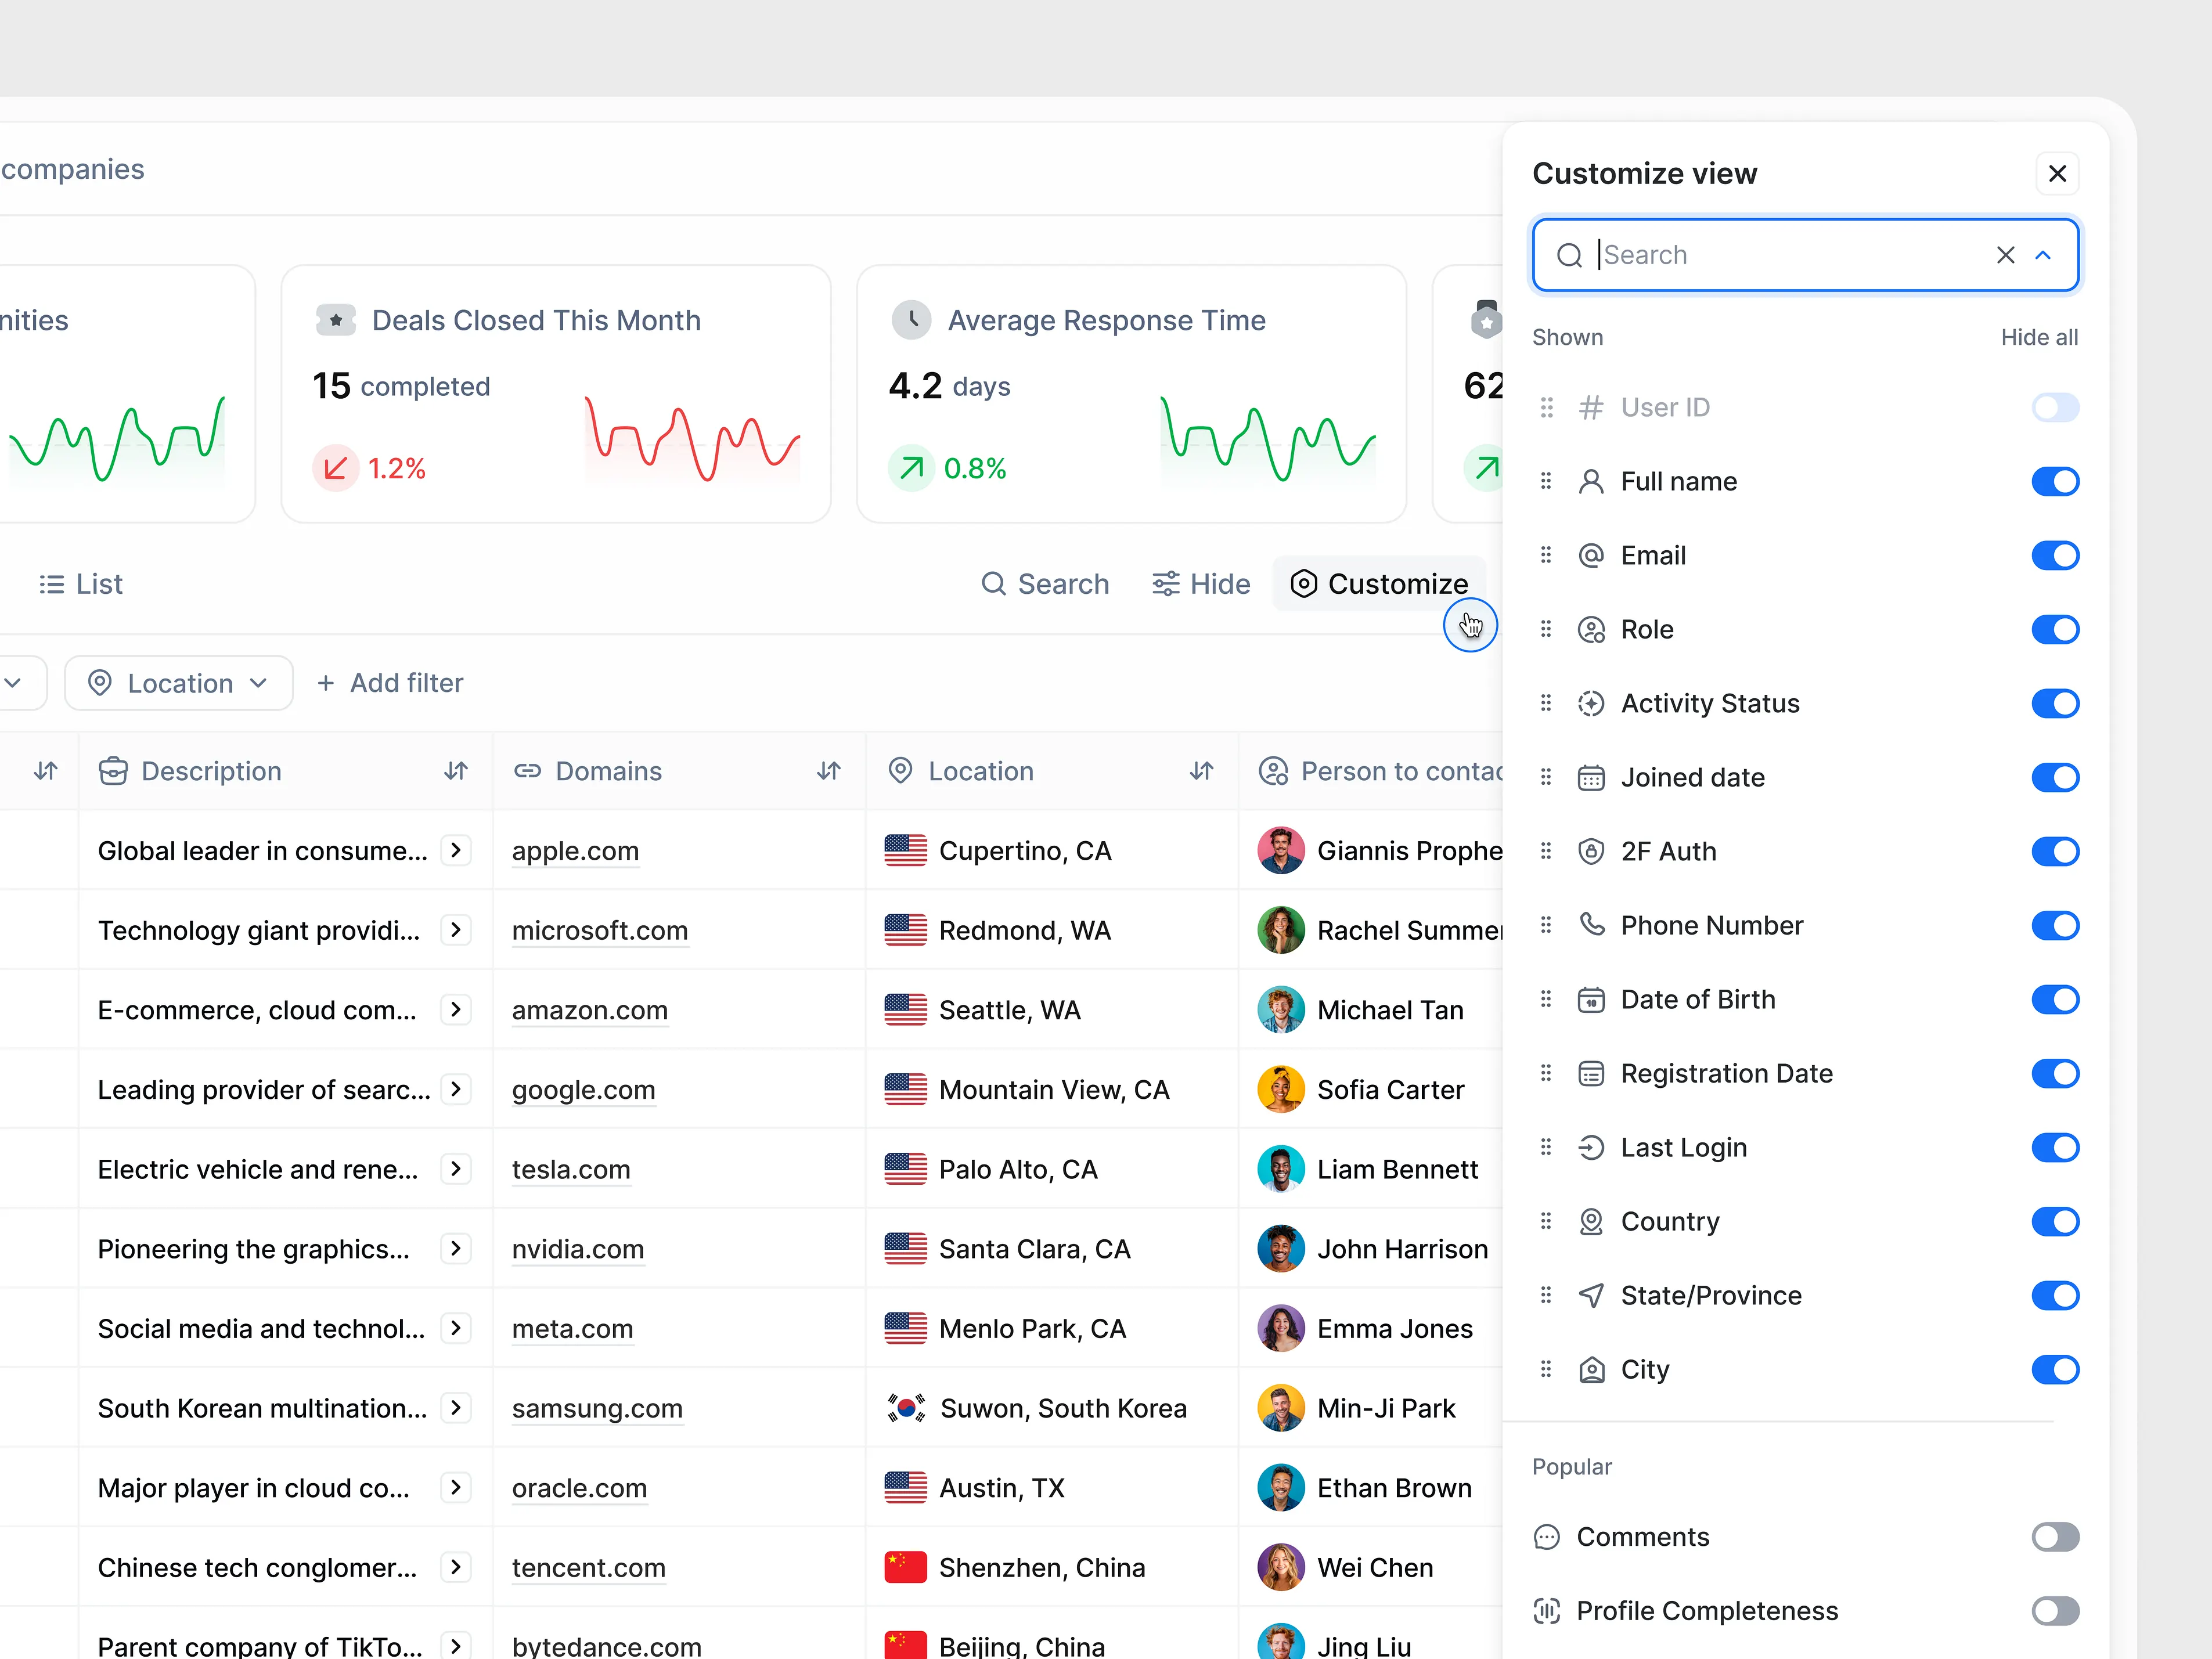
Customize Data table

Table | Google AI Studio - The fastest path from prompt to production

Stellar dashboard
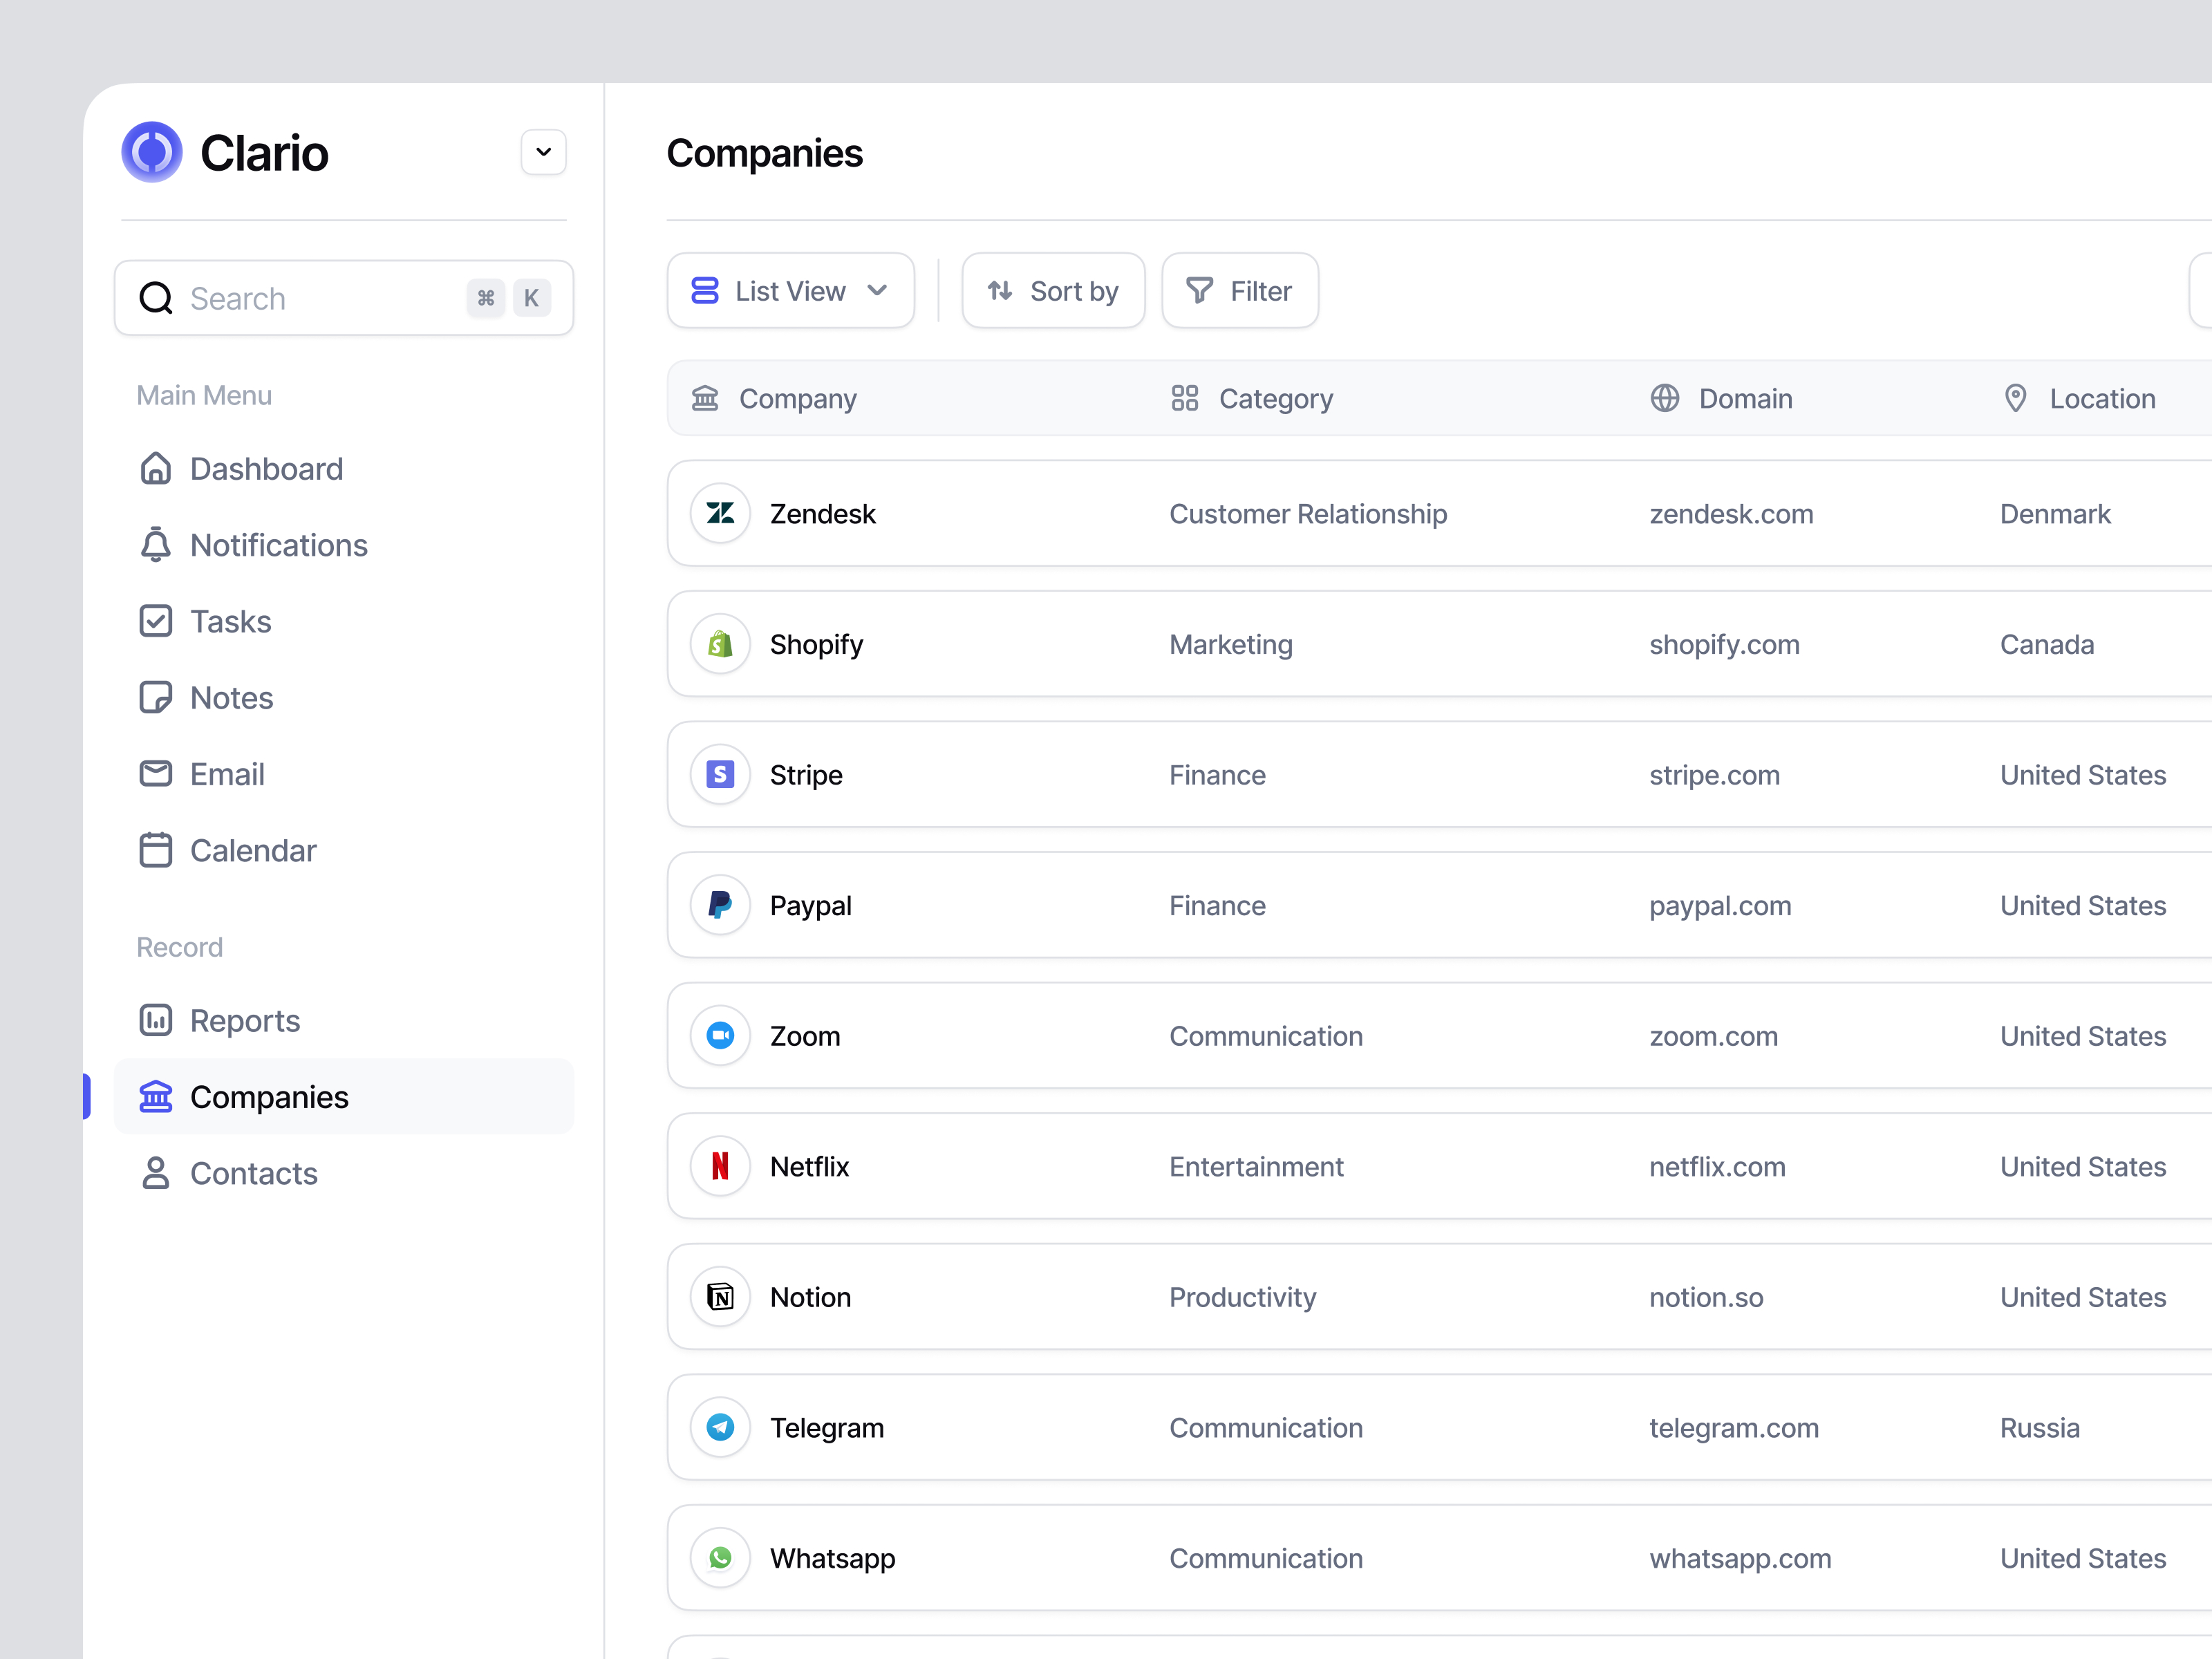
Clario - CRM Data Table

Table | Chatbase - AI agents for customer service

Ecomiq – Add Product Variants & Track Sales Performance
This is 1% of what Muzli shows you.
Get the rest — fresh design inspiration on every new tab, free.
Add Muzli — free
Complex Table Design with brixui.com

Table | QuickBooks - Smart tools. Better business.

E-commerce Dashboard
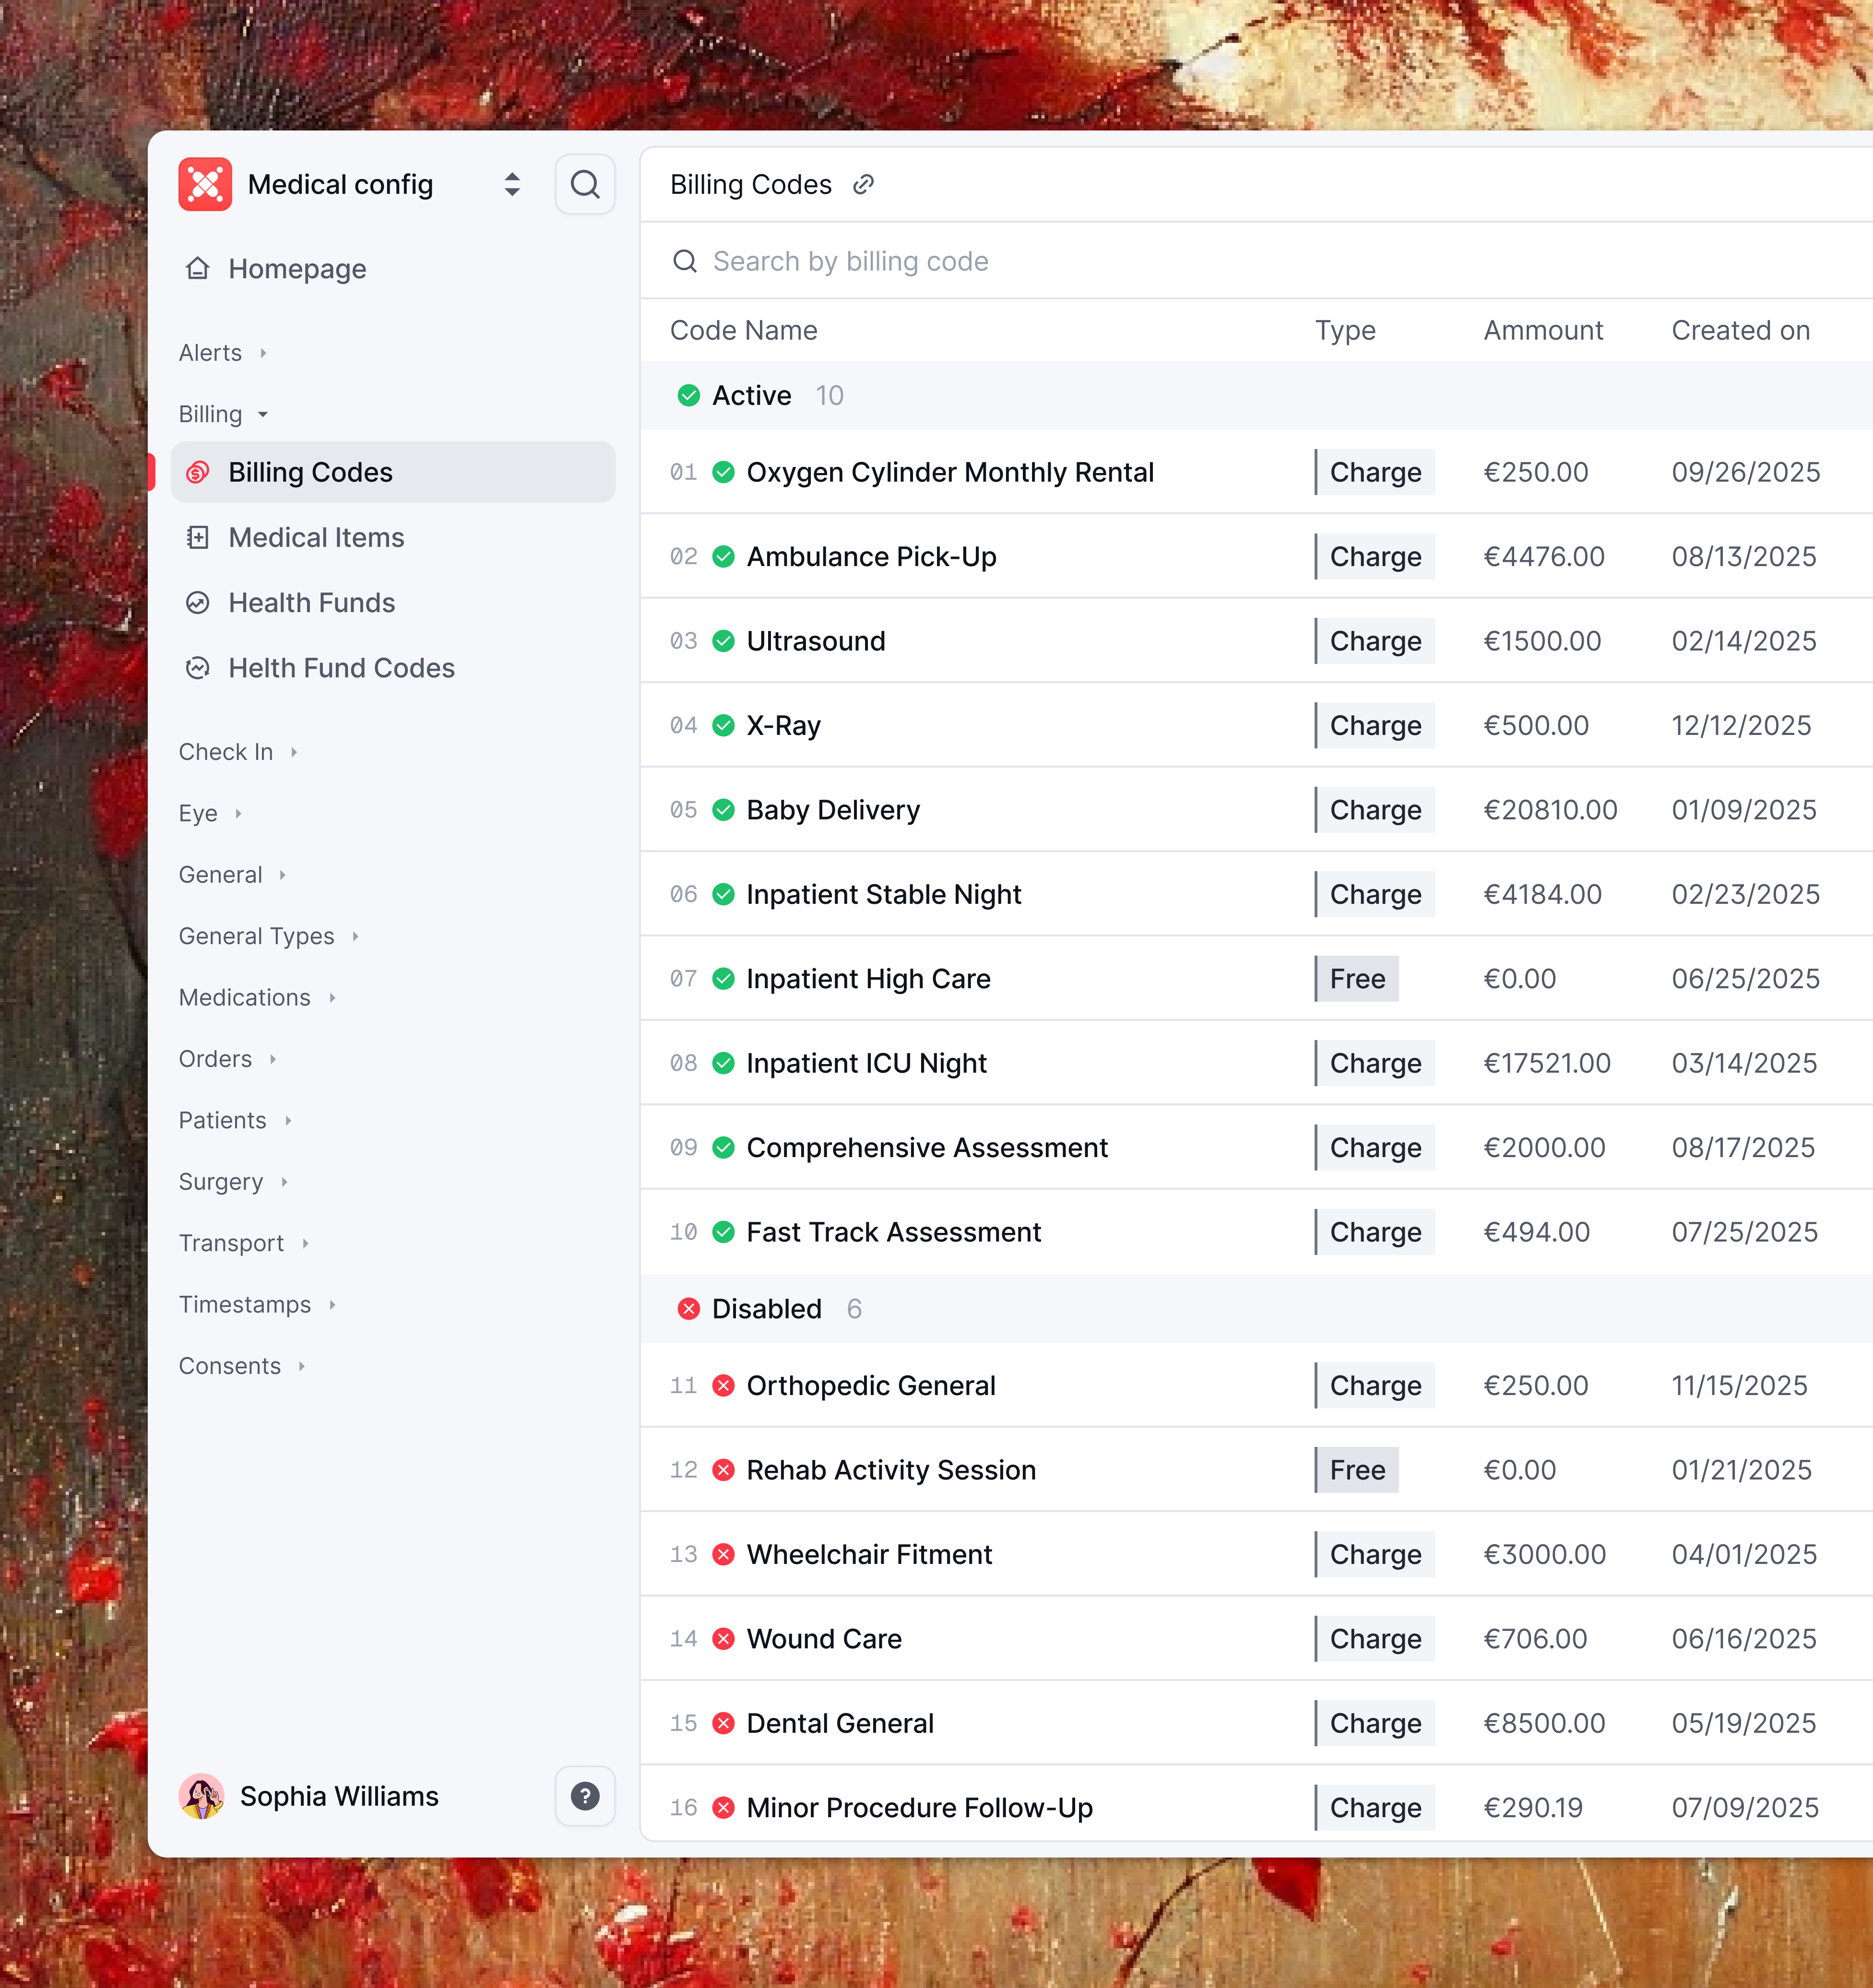
Data table

Table | Notion Mail - The inbox that thinks like you

Trenning – Course Enrollees in the SaaS LMS
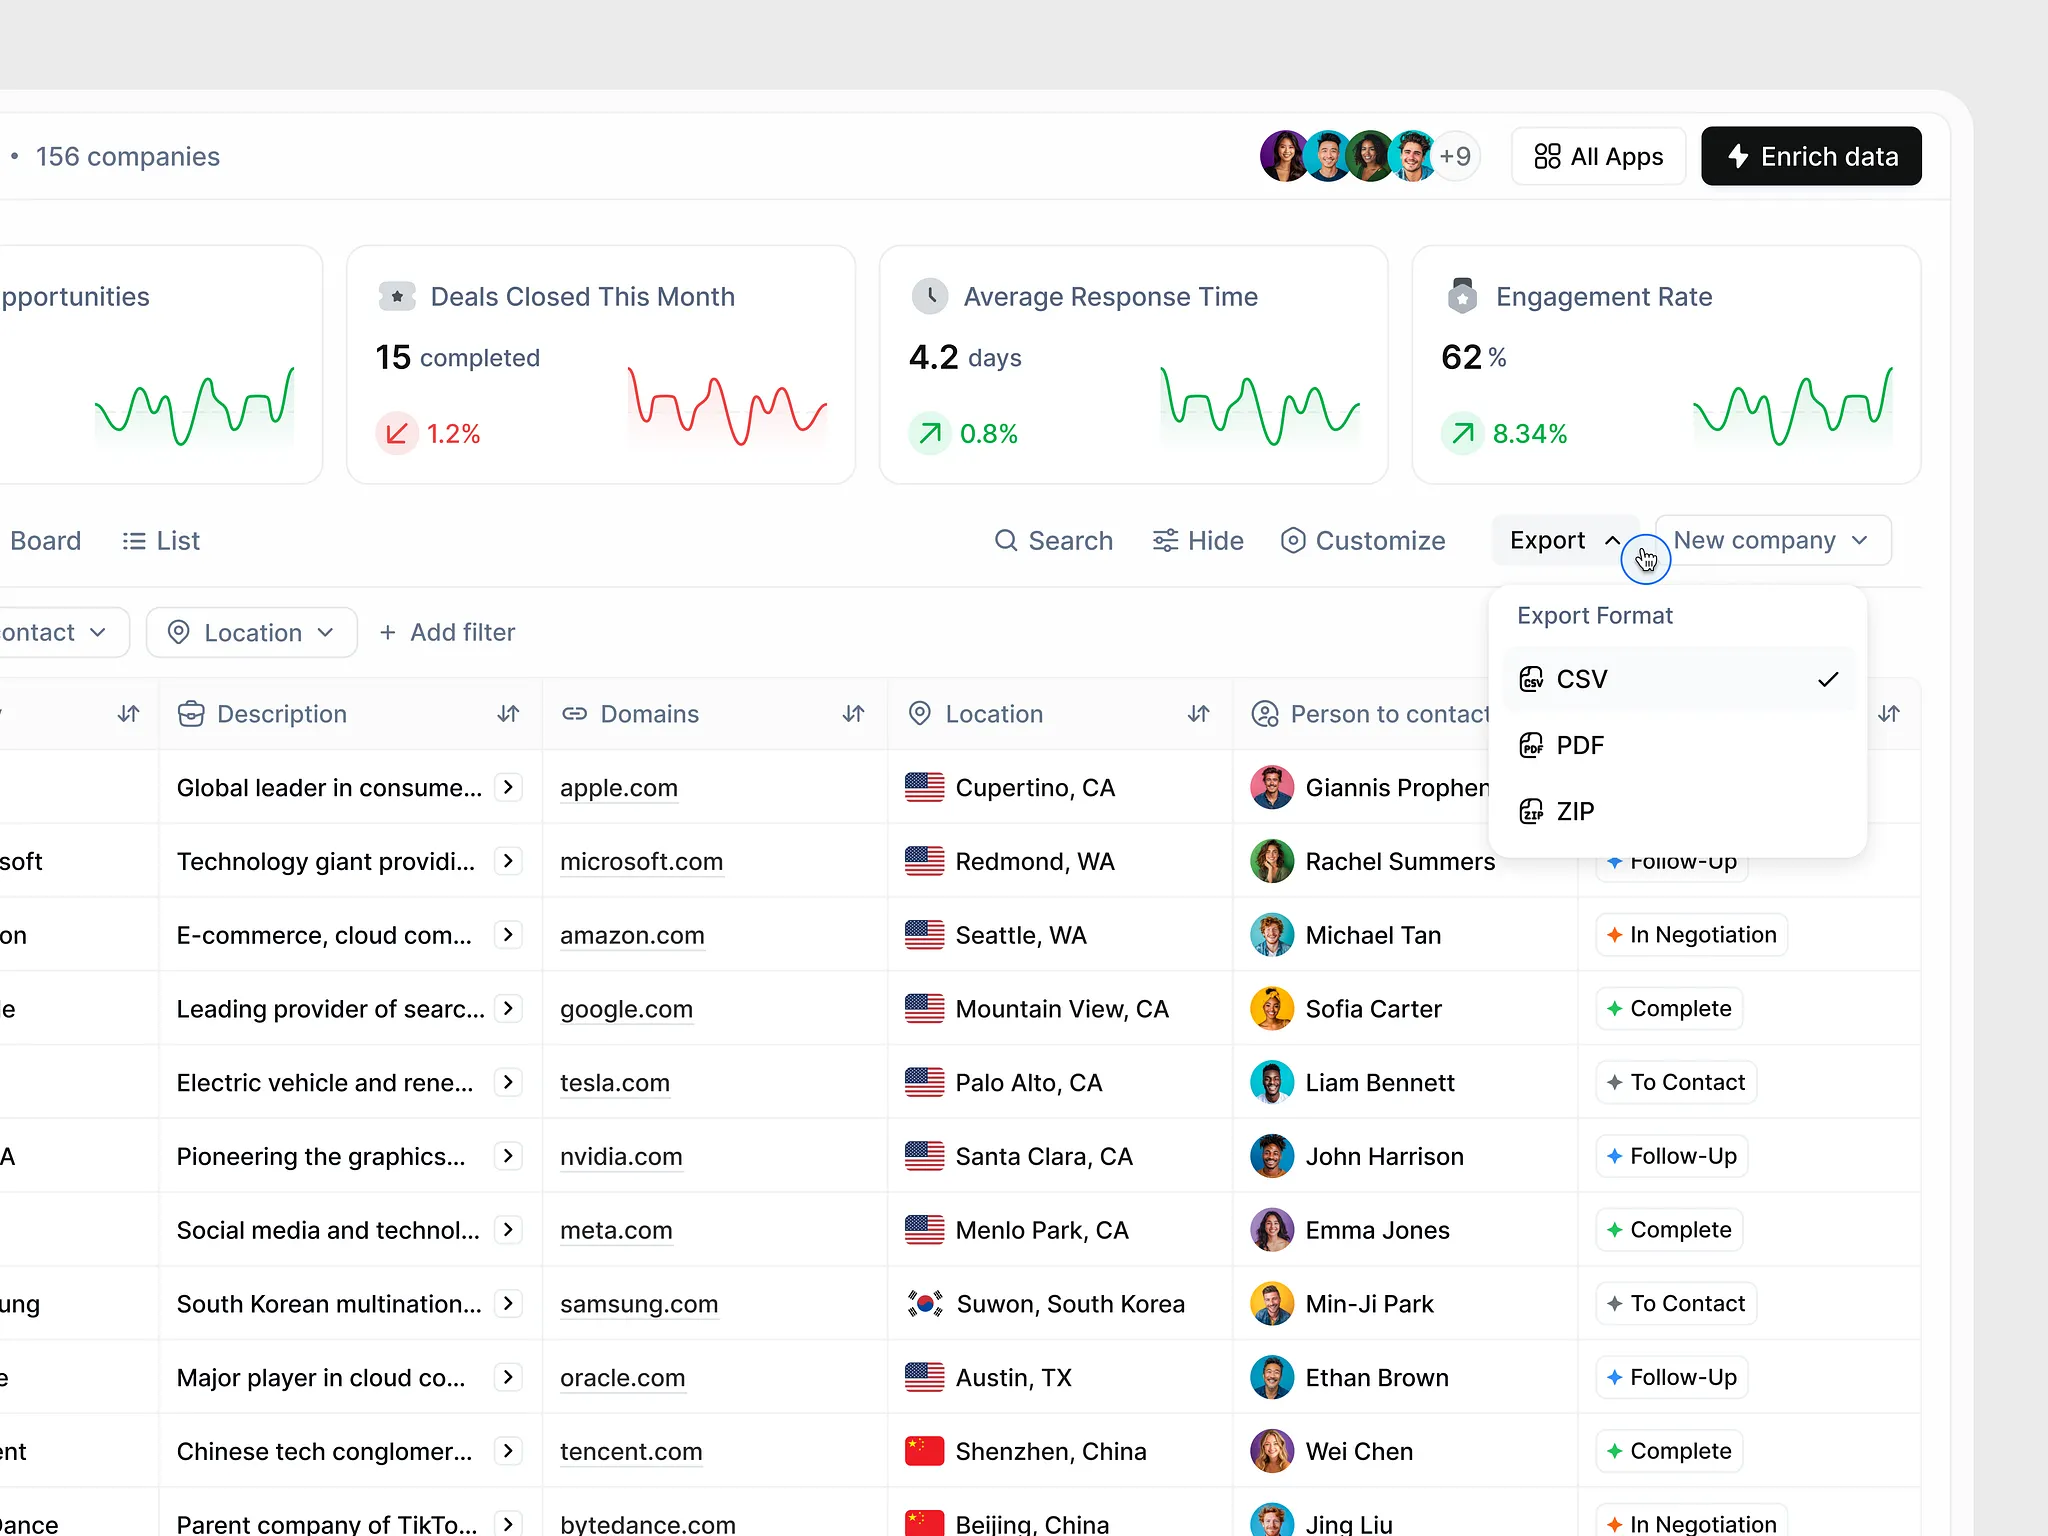
Export data table

Table | OpenAI Platform - Build leading AI products

Divebix Product

Nested Table UI for Business Management Teams

Table | Linear - The system for product development

Stellarsync - SAAS CRM Dashboard Order Page
This is 1% of what Muzli shows you.
Get the rest — fresh design inspiration on every new tab, free.
Add Muzli — freeStellarsync - SAAS CRM Dashboard Order Page
Get access to thousands of freshly updated design inspiration pieces by adding Muzli to your browser.
Loved by 900k designers worldwide, Muzli is the leading go-to browser extension for creative professionals.
What is a data table in UI design?
A data table shows a set of records as rows and their attributes as columns. It is the default way to present anything a user needs to scan, compare, sort or edit in bulk: orders, users, transactions, logs. A good table lets people find one row quickly and act on many rows at once.
What makes a table easy to read?
Left-align text and right-align numbers, so digits line up for comparison. Keep the header visible while the table scrolls. Separate rows with spacing and light dividers, not heavy grid lines. Put the identifying column first and freeze it when the table scrolls sideways. Shorten long values and show the full text on hover or in a detail view.
Pagination or infinite scroll for tables?
Pagination suits tables people work through or return to, because a page number is a place they can come back to. Infinite scroll suits logs and feeds that are read once from the top. For large data sets, add filters and search before adding more rows per page.
Where do these table examples come from?
About half are tables from shipped products documented by Mobbin. The rest are table designs published on Layers and Dribbble. Muzli follows more than 200 design sources and lists up to 60 matching pieces here, favouring recent work.
All collections
UI design
Screens & flows
Apps
Components
Kits, mockups & icons
Web design
Websites
Pages & sections
Graphic design
Posters & print
Marketing
Illustration & motion
Type & graphics
Branding
Logos & identity
Packaging & stationery